The city already drew the map. Trodden reads it.
Trodden detects desire paths from public imagery, scores them with real movement evidence, heat-maps where people actually travel hour by hour, and lets planners walk the findings in 3D before committing a dollar of infrastructure.

Everyone can see the worn path. Nobody can defend the decision.
Formal path networks, aerial imagery, and movement data live in separate systems with different fidelity and provenance. A planner staring at a dirt scar in satellite imagery still can't defend the decision that releases budget: is it genuinely unserved, does it persist across seasons, does observed movement support intervention, and can the recommendation survive review?
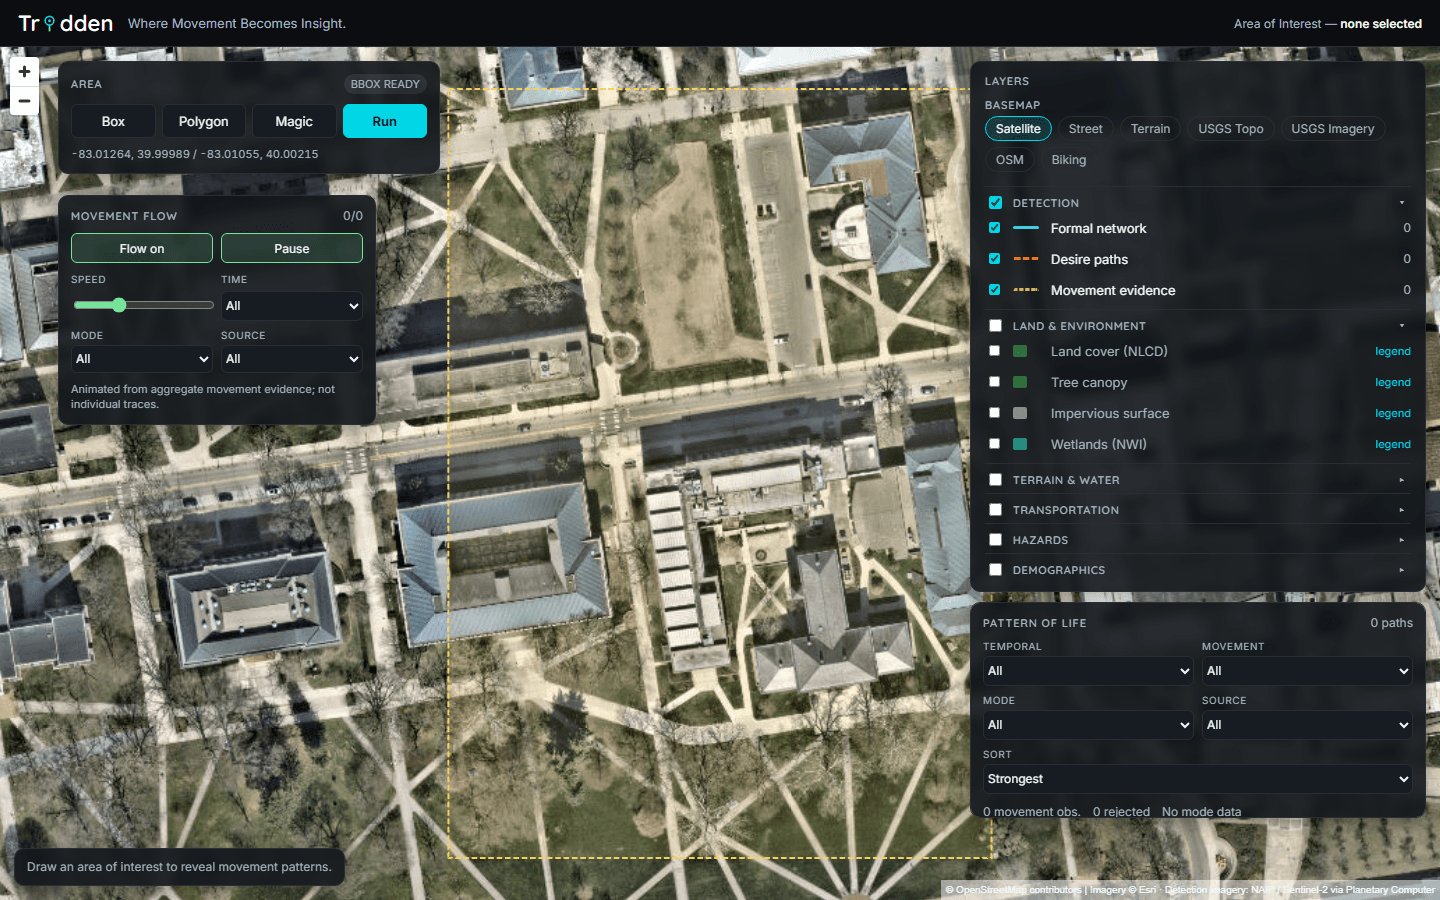
A separable, auditable detection pipeline turns public, key-free imagery into ranked desire paths, scores them with provider-neutral movement evidence, and serves everything through a registry-driven MapLibre surface — with provenance on every row and meters, not degrees, behind every spatial claim.
From public imagery to ranked, reviewable evidence.
Every stage is separable and auditable. Public, key-free sources in; provenance-preserving records out.
Area of Interest
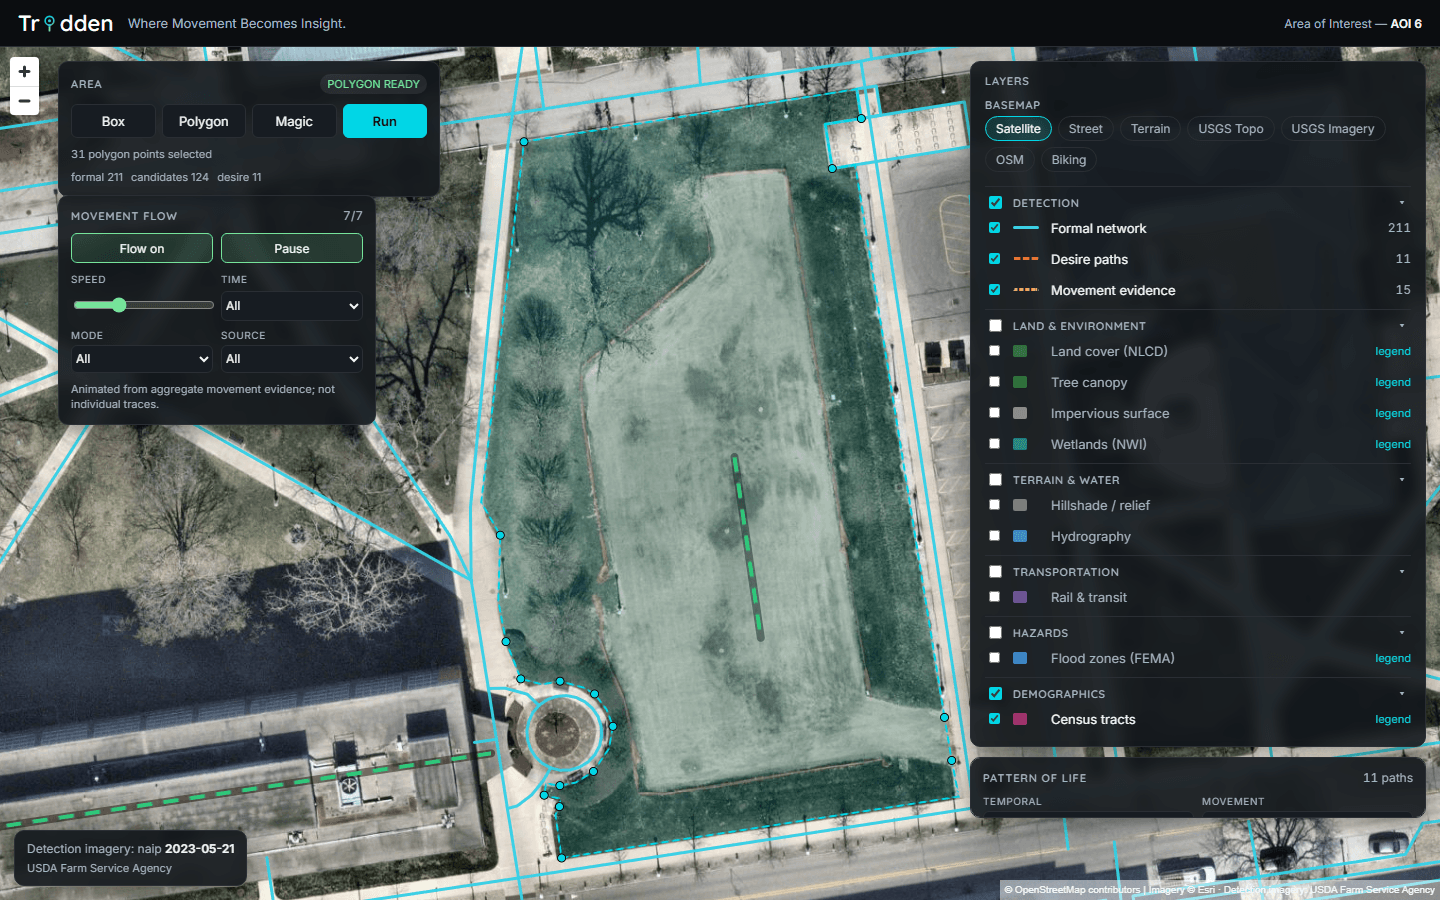
Box, polygon, or one-click magic select snapped to a park, campus, or corridor. Runtime bounded by a 2.0 km² guard.
Formal network + imagery
OpenStreetMap ways and building footprints; multi-date NAIP / Sentinel-2 captures via Planetary Computer STAC.
Bare-earth segmentation
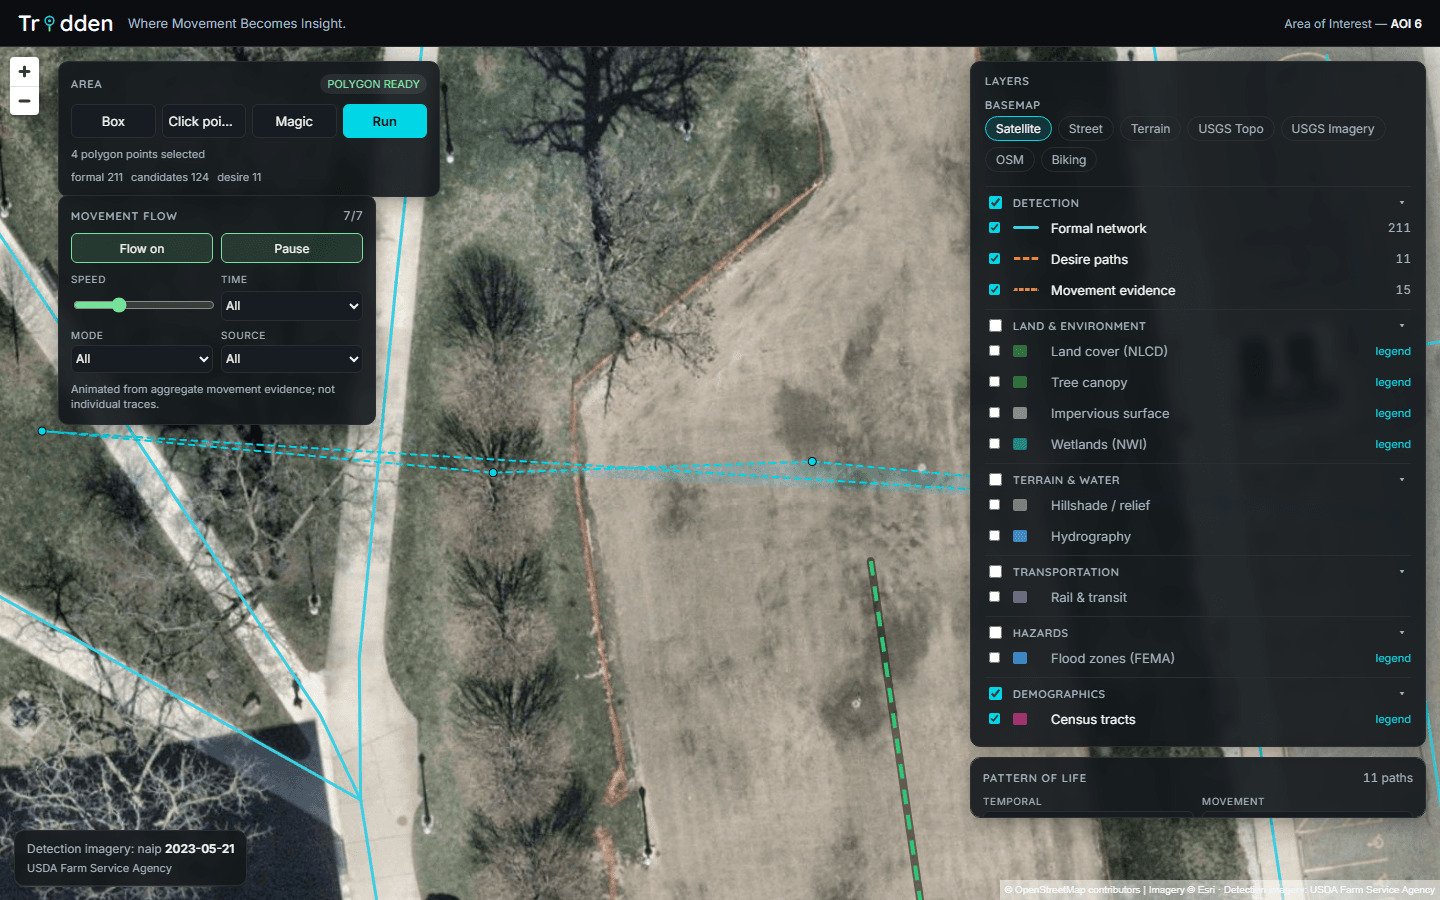
OpenCV low-NDVI thresholding, morphology, skeletonization, and Hough vectorization surface candidate trails.
Spatial plausibility gates
Candidates survive only if ≥50% of their length stays >10 m from formal ways, both endpoints reconnect, and they avoid building footprints — measured in meters via PostGIS geography, never degrees.
Temporal persistence
Detections cluster within 12 m across capture dates and classify as persistent, seasonal, emerging, declining, or transient.
Evidence scoring
Counts, trips, and shared-mobility context ingest through a provider-neutral schema with match method, distance, and batch provenance on every row.

Walk the finding before you fund it
Trodden's street walk drops the analyst from the top-down map to eye level — a designed 3D scene with true-width roads, footpaths, and extruded buildings, rendered entirely from key-free vector data. Click any street and you land on it, facing down it. Every data layer stays live around you.

Built like a game, grounded like a survey
- Road-snap entry: clicks snap to the nearest street or footpath centerline and face along its bearing.
- Geometric collision: building footprints stop the walker a step short of every wall. No clipping.
- Designed ground: at eye level, a purpose-built vector scene replaces stretched imagery — meter-true asphalt, sidewalks, centerlines.
- Analyst-first: desire paths and movement evidence render at street level, where a pedestrian experiences them.




Scrub a week of the city breathing
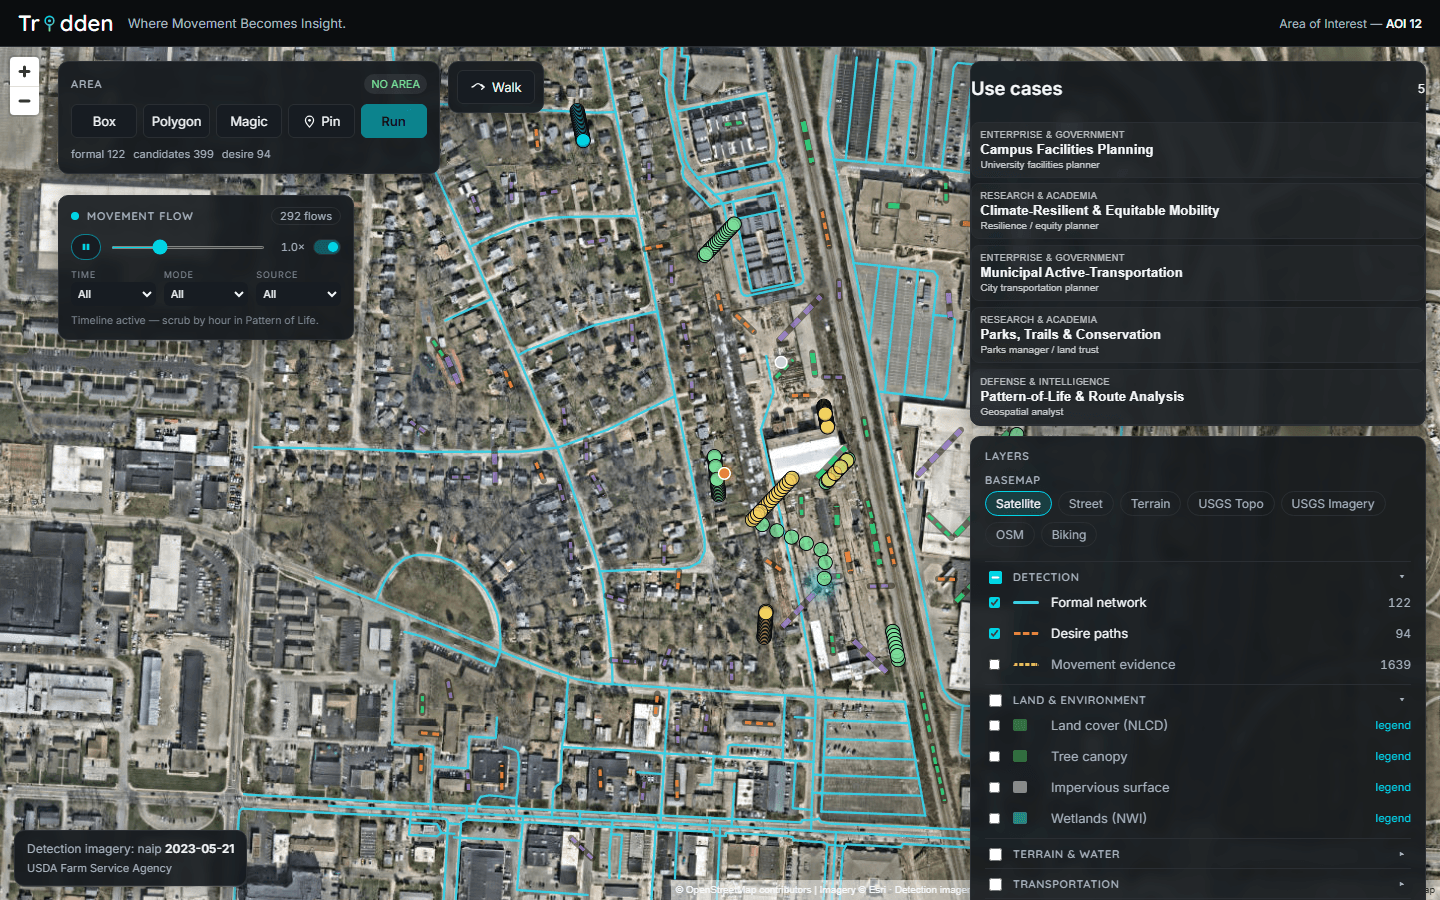
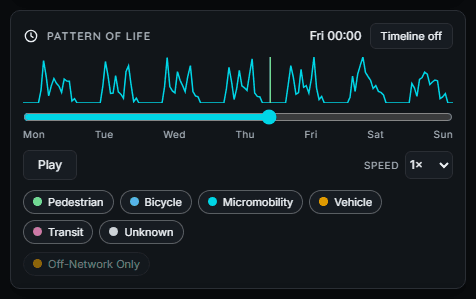
Every movement observation lands in a 168-hour week. The Pattern of Life timeline scrubs it: commute pulses on weekday mornings, recreation across weekend afternoons, silence at 3 AM. Congregation zones glow as a heatmap, and movement with no underlying infrastructure renders in warning amber — the platform's core signal.

Aggregate by design
- 168 hourly buckets with a weekly sparkline and playback at 0.5–4×.
- Mode filtering: pedestrian, bicycle, micromobility, vehicle, transit — colorblind-safe palette.
- Off-network isolation: one toggle strips the view to unserved movement.
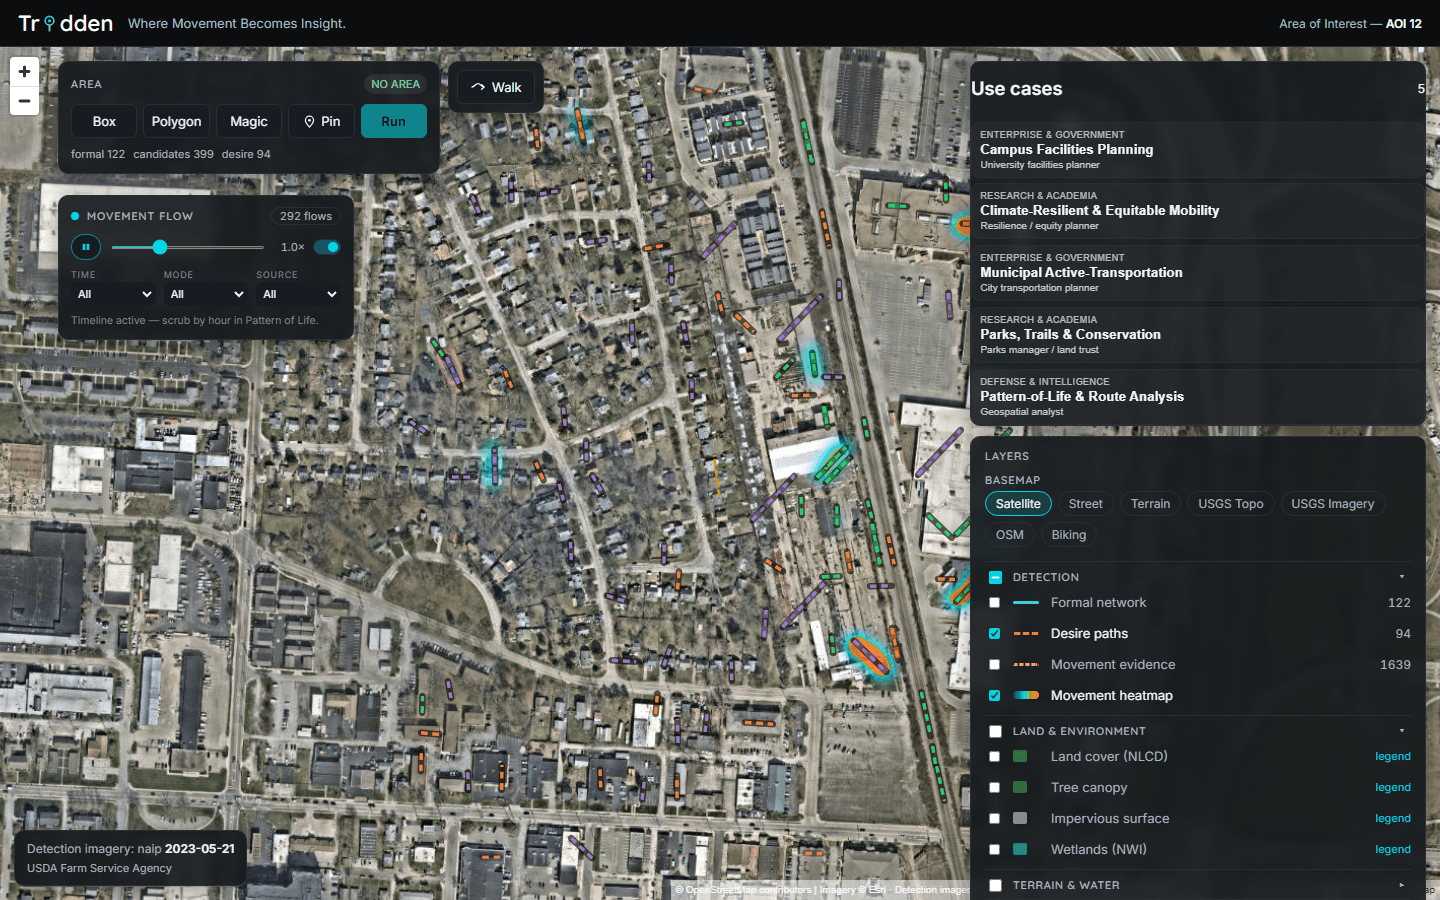
- Heat follows the scrubber: the traversal heatmap re-aggregates to the matching time window.
Where a thousand trips pile up, the ground glows
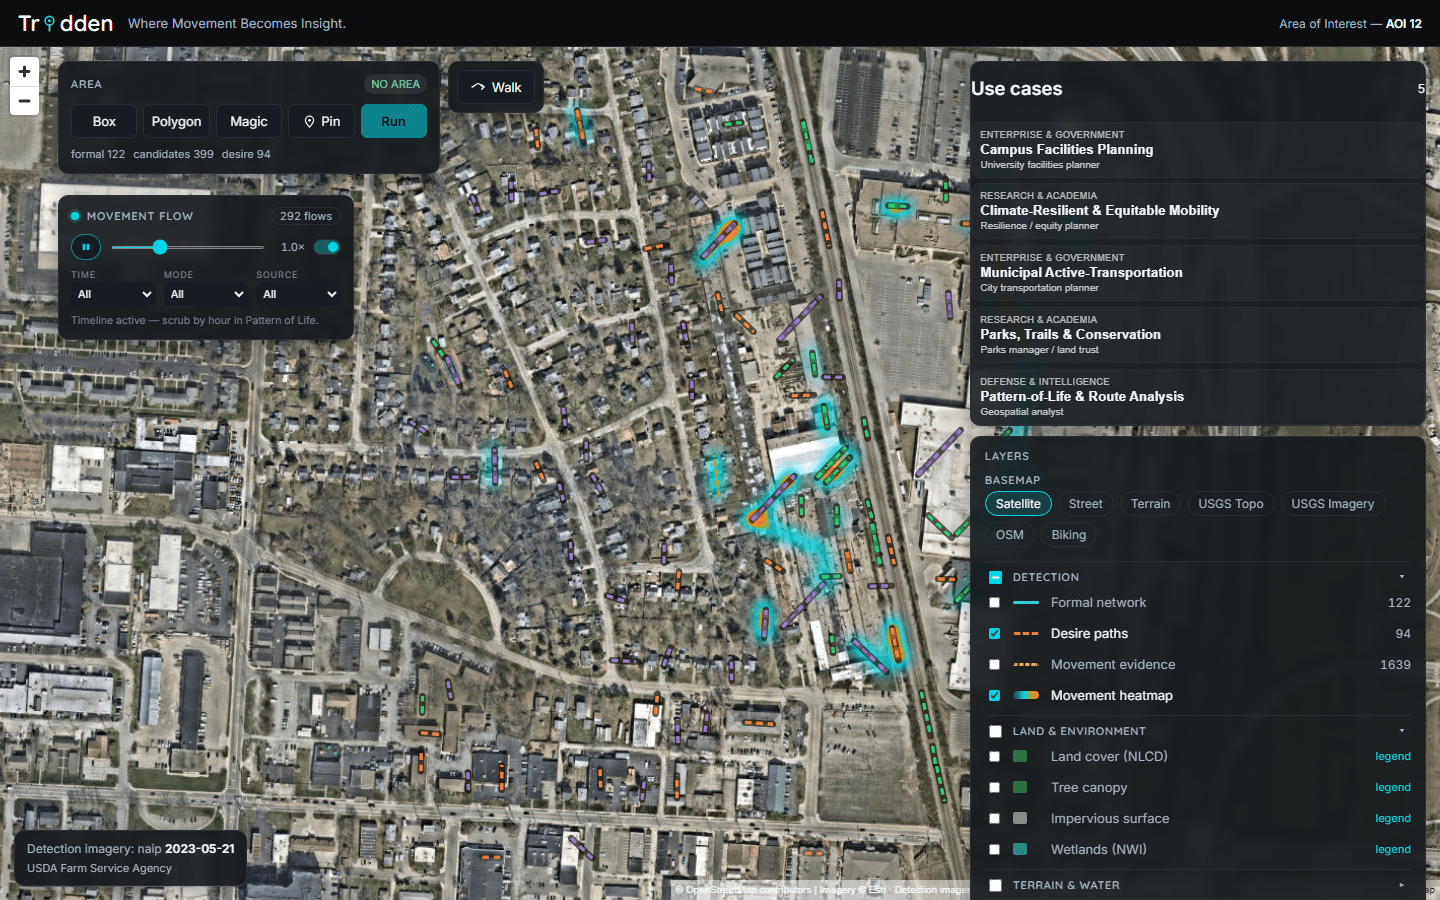
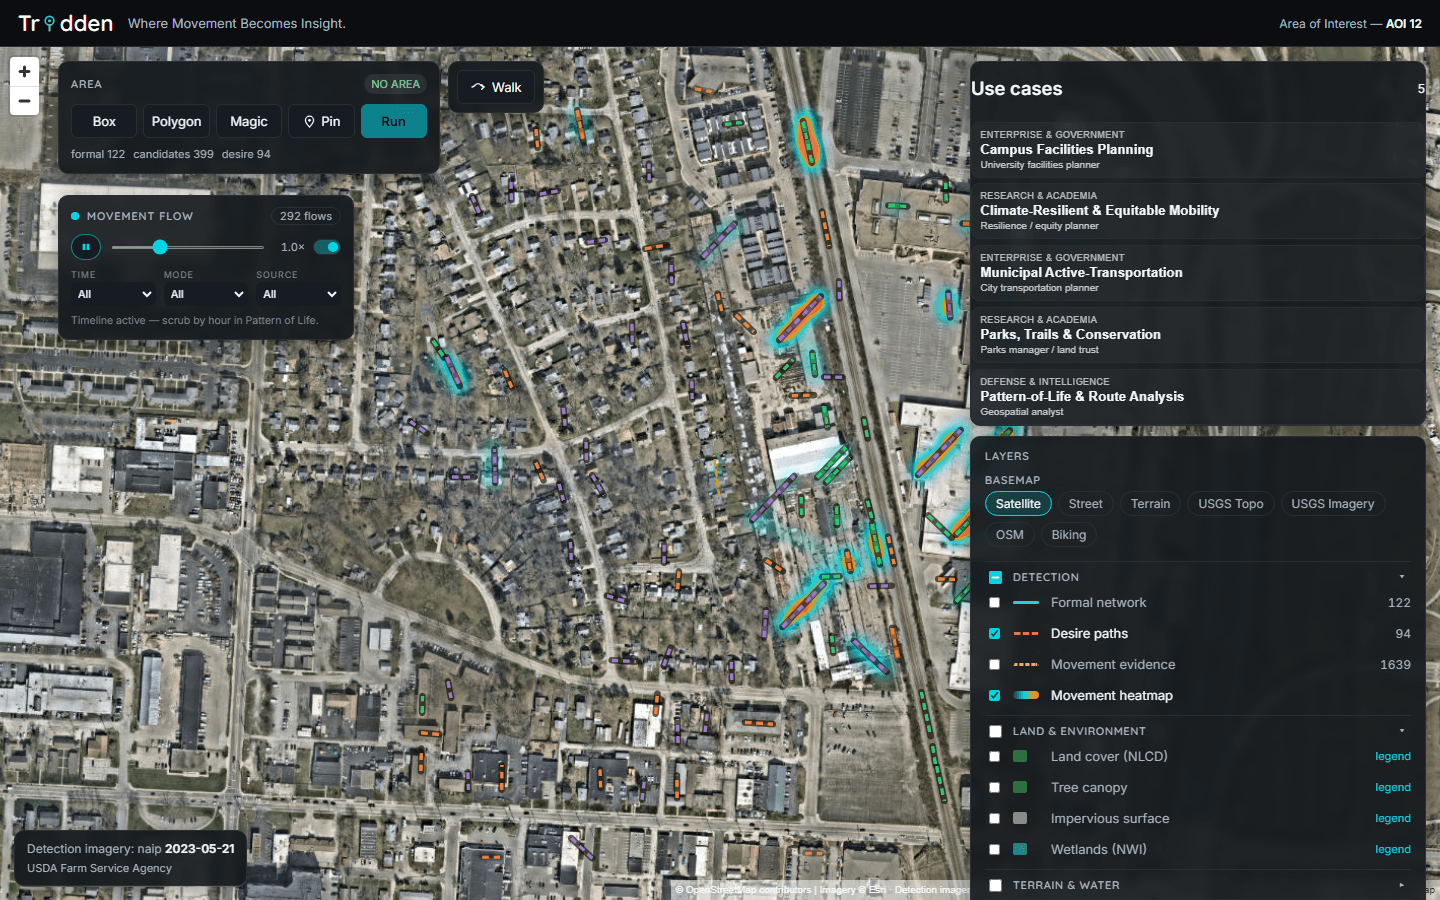
Flows show motion; the movement heatmap shows accumulation. Every trip is resampled along its geometry, snapped to an 8-meter grid, and its traversal volume summed per cell — server-side, in PostGIS, in true meters. Cool cyan where people occasionally pass, desire-path orange where the route is genuinely worn in.

An aggregation, not a sticker
- Meter-true resampling: trip lines are segmented every 8 m through PostGIS geography, so heat follows geometry.
- Double-count guarded: one observation contributes once per cell, however dense its geometry.
- Filter-faithful: mode, time window, and data source each trigger a server-side re-query.
- Legend built in: the layer row carries the actual color ramp — cyan for light use, orange-red for most-trodden ground.
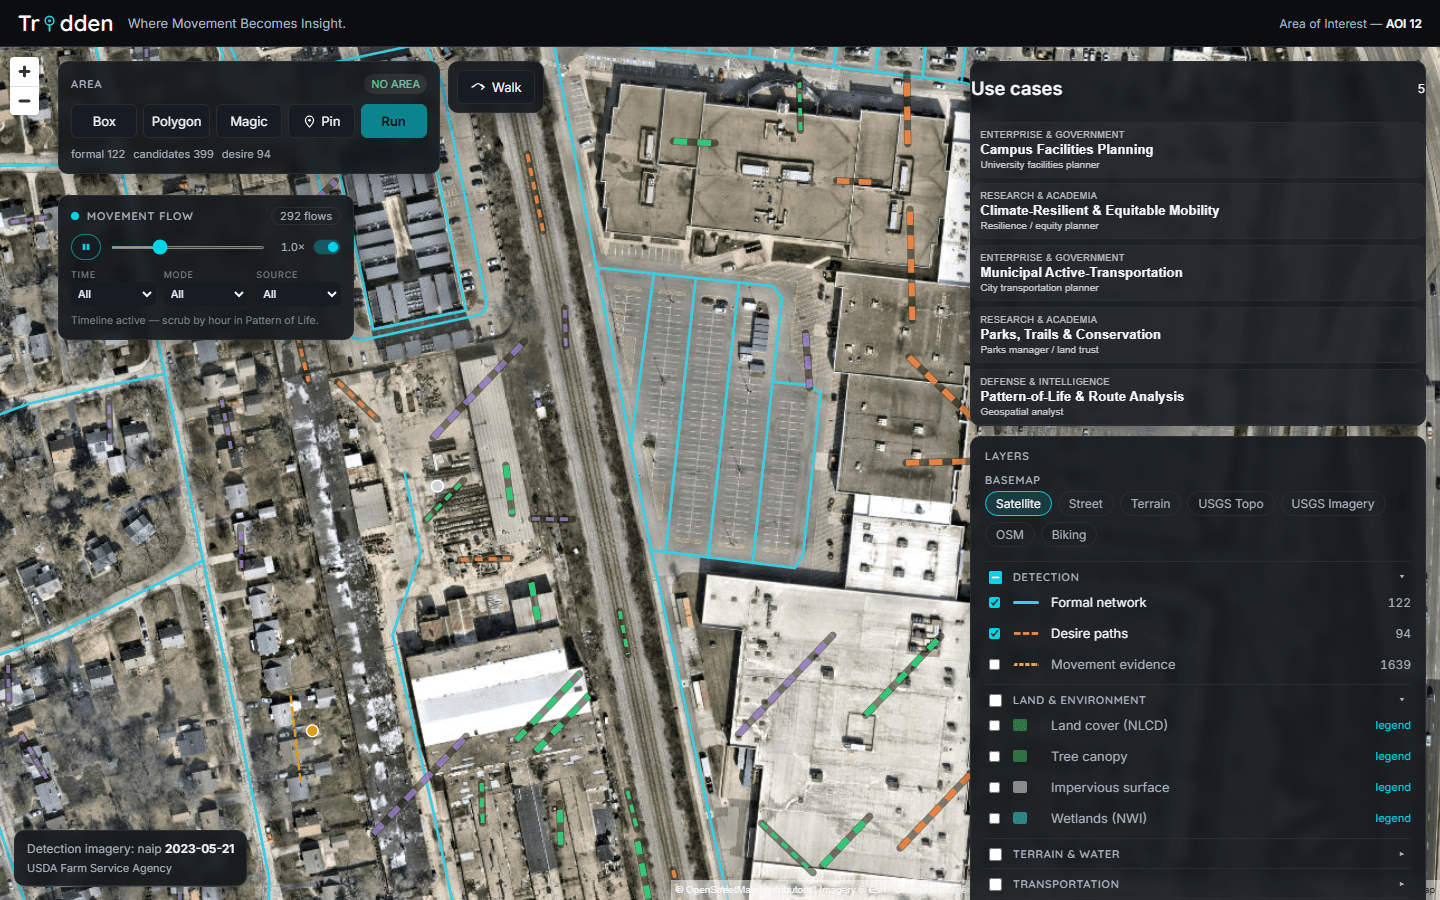
Movement flow, on the second the data loads
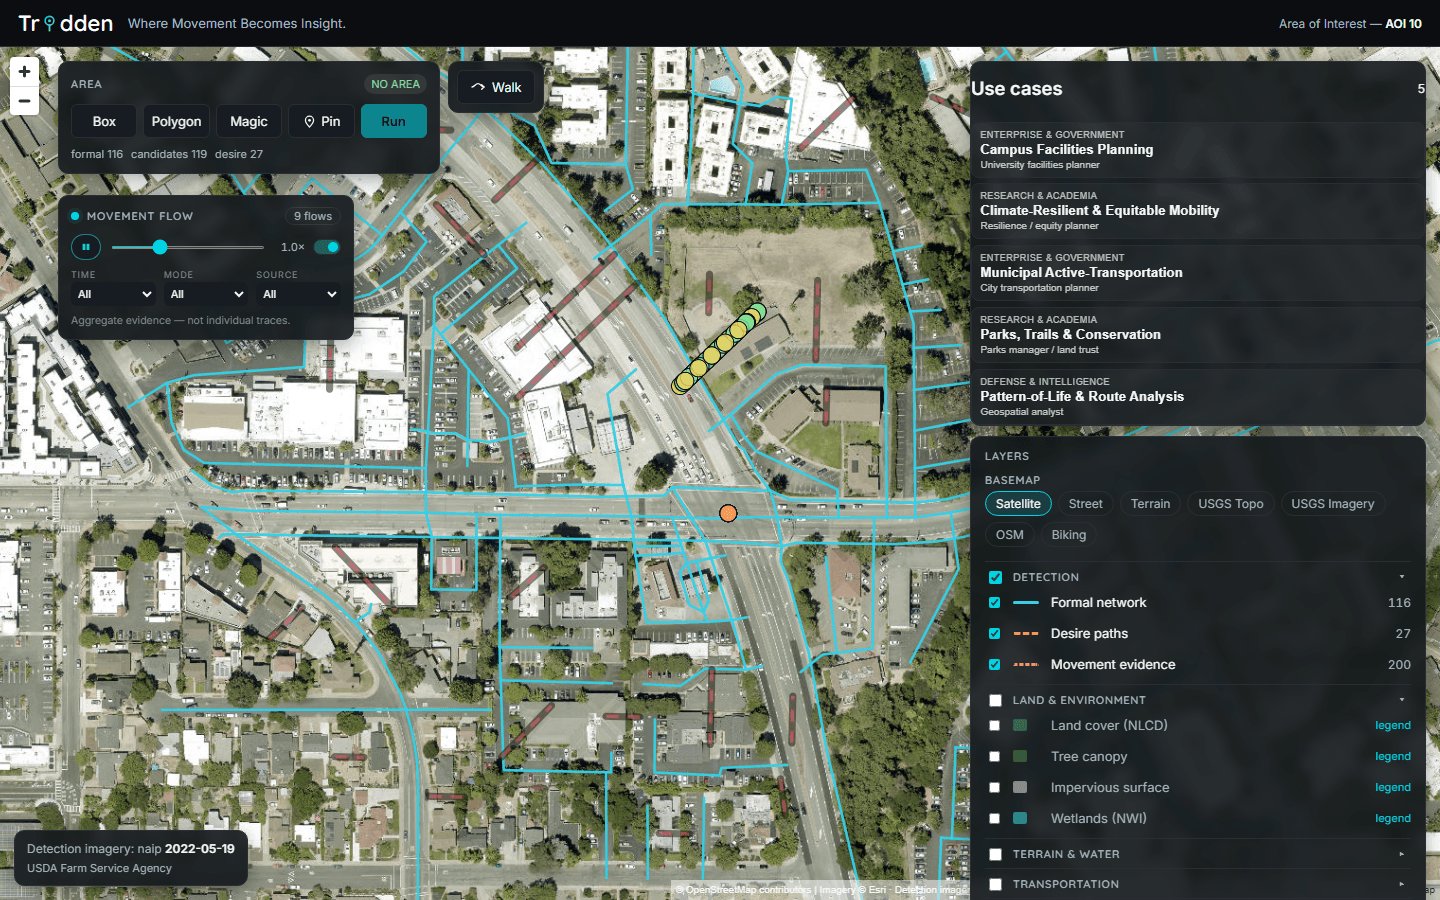
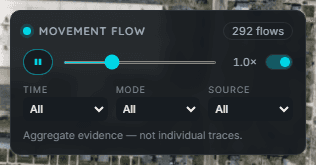
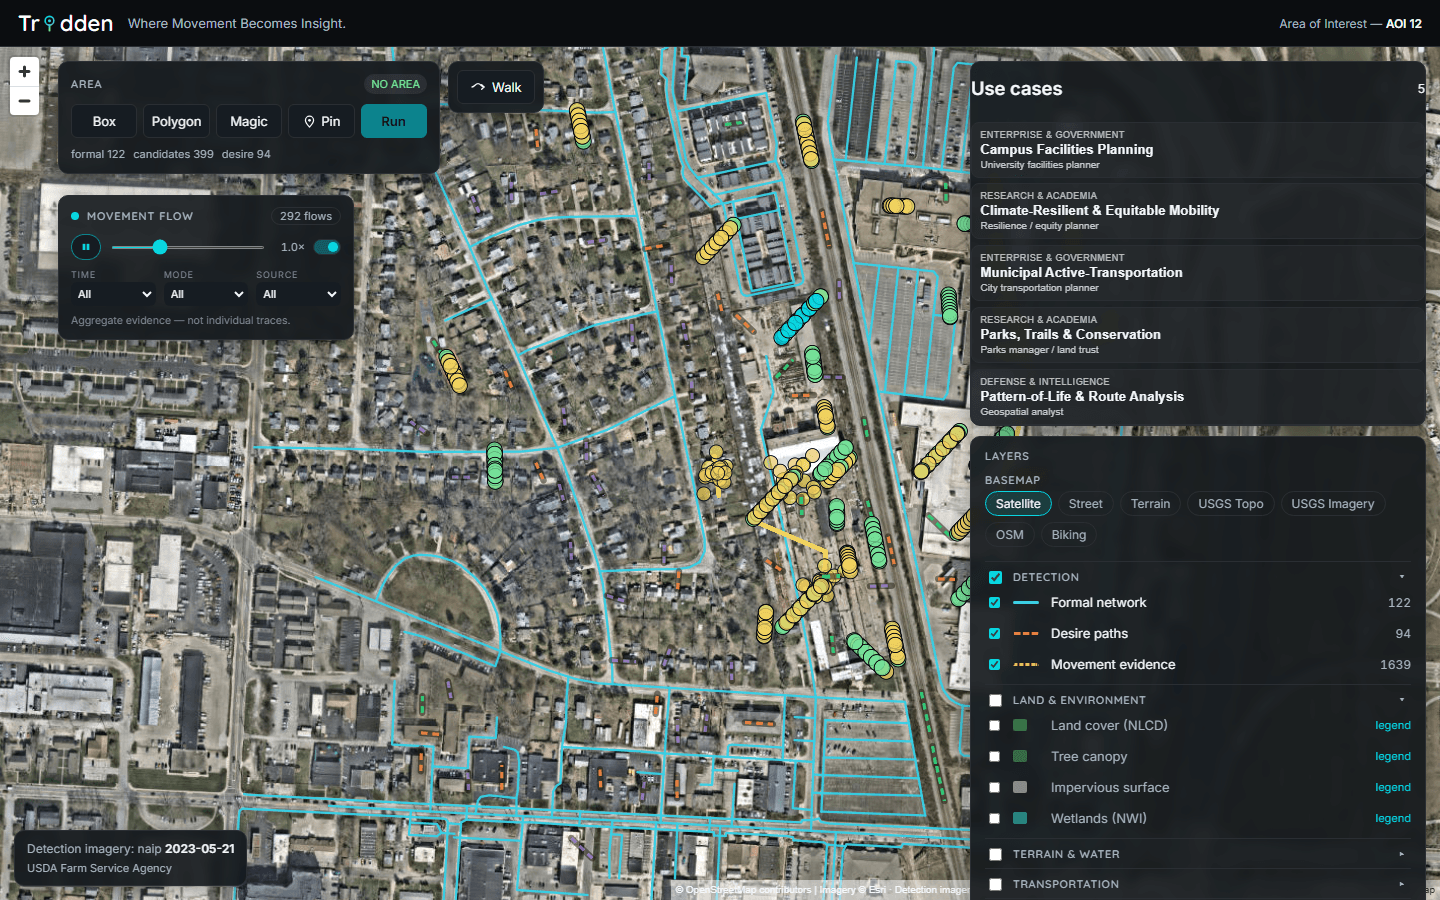
Aggregate flows animate along the actual detected geometry the moment an area proves to have evidence — no configuration. The same schema ingests real Caltrans active-transportation counts, GBFS shared-mobility feeds, CSV trip exports, and partner APIs; every observation records its source, match method, and match distance, and rejected rows are kept for audit.

Real data, provider-neutral
- 200 real Caltrans counts scored and animated in the California validation AOI.
- 30 m geography matcher attaches evidence to detected paths; unmatched movement is retained as off-network signal, not discarded.
Pin the problem where it happens.
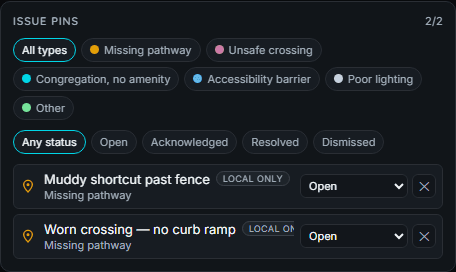
Findings become work items. Analysts drop issue pins — missing pathway, unsafe crossing, congregation without amenity, accessibility barrier, poor lighting — from the top-down map or at the street-view crosshair. Pins auto-link to the nearest detected desire path, carry a full status workflow, and persist through the platform API.

From observation to accountable record
- Six categories tuned to pedestrian-infrastructure review, color-coded on the map.
- Status workflow: open → acknowledged → resolved / dismissed, editable inline.
- Auto-association: pins within 25 m of a detected desire path link to it automatically.
- PostGIS-backed API with full CRUD — pins are data, not decorations.
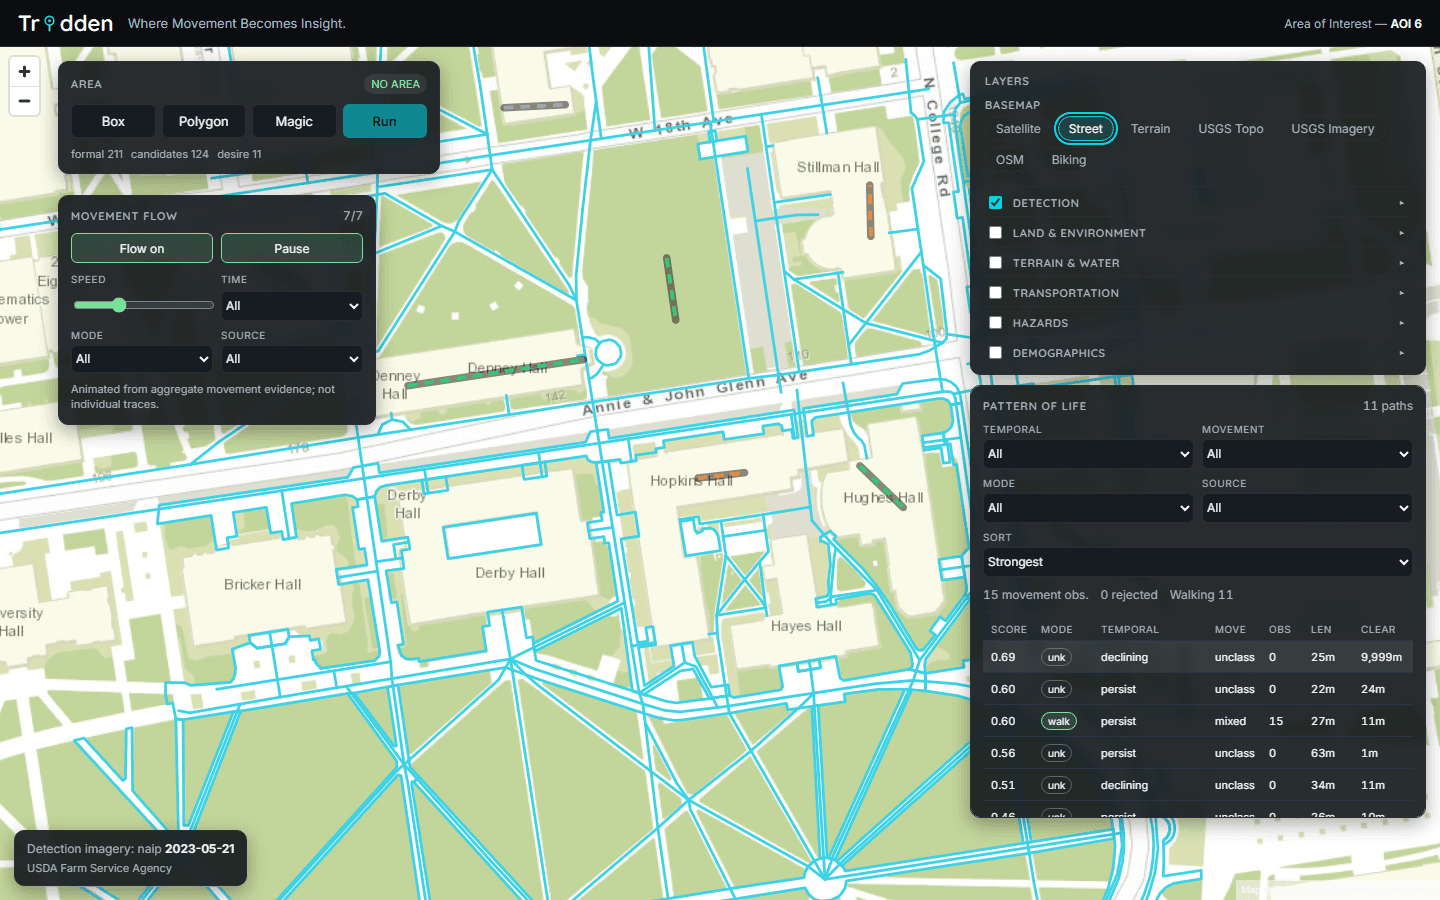
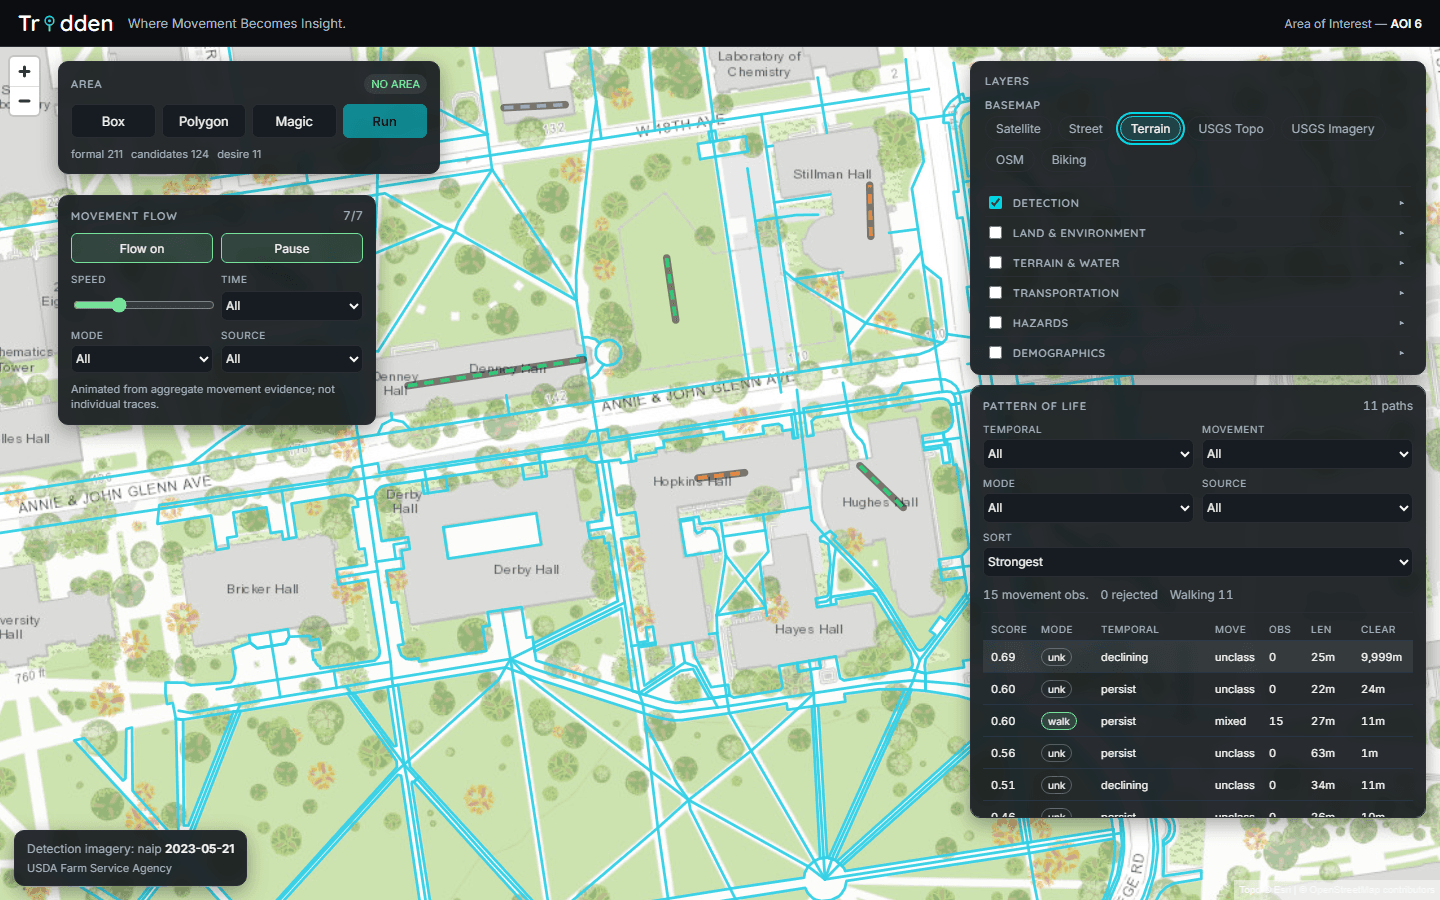
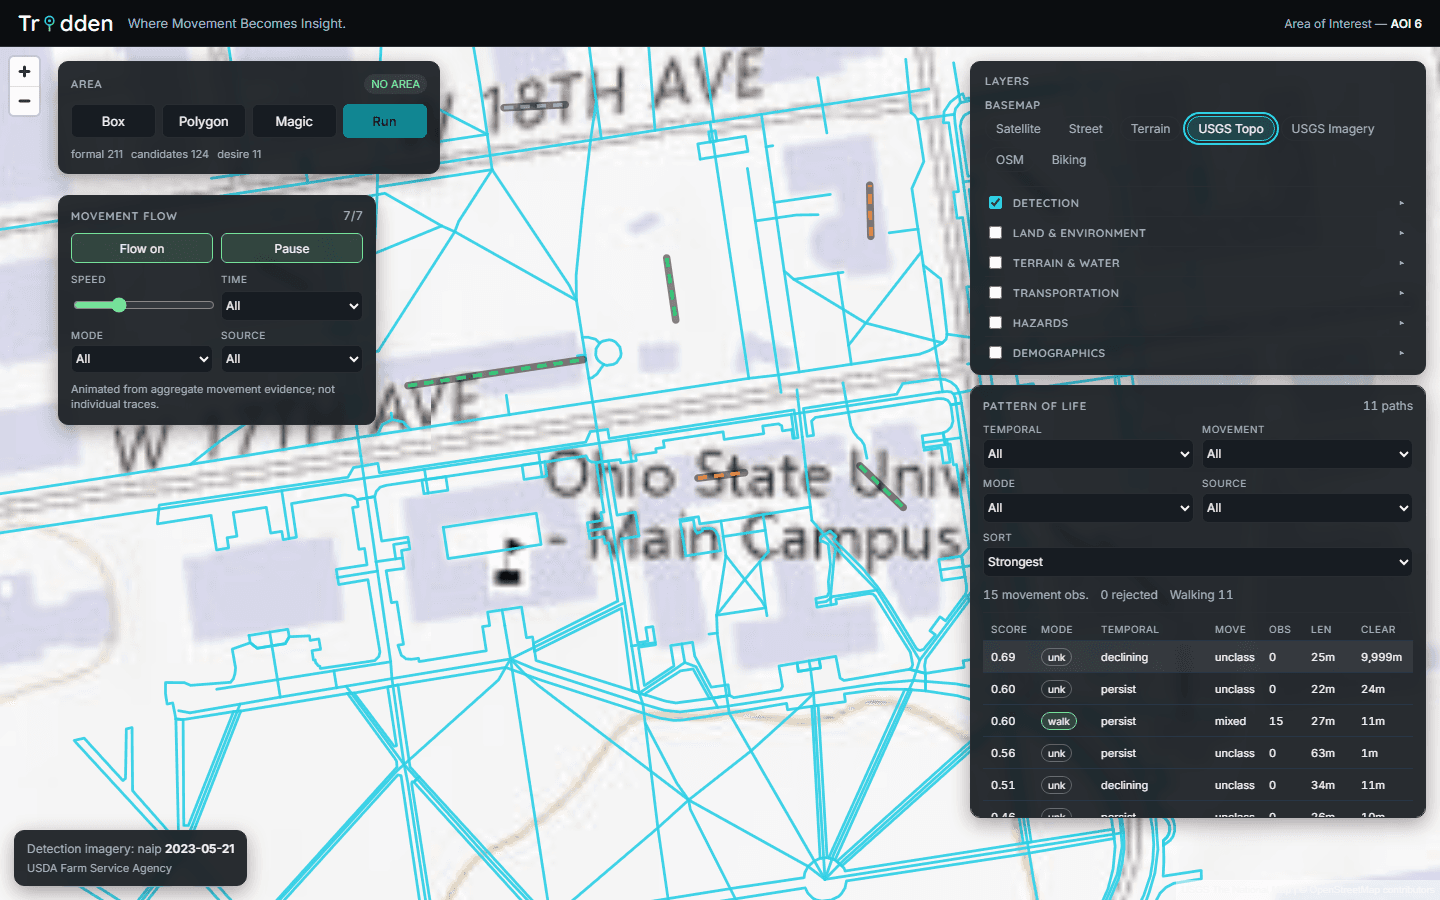
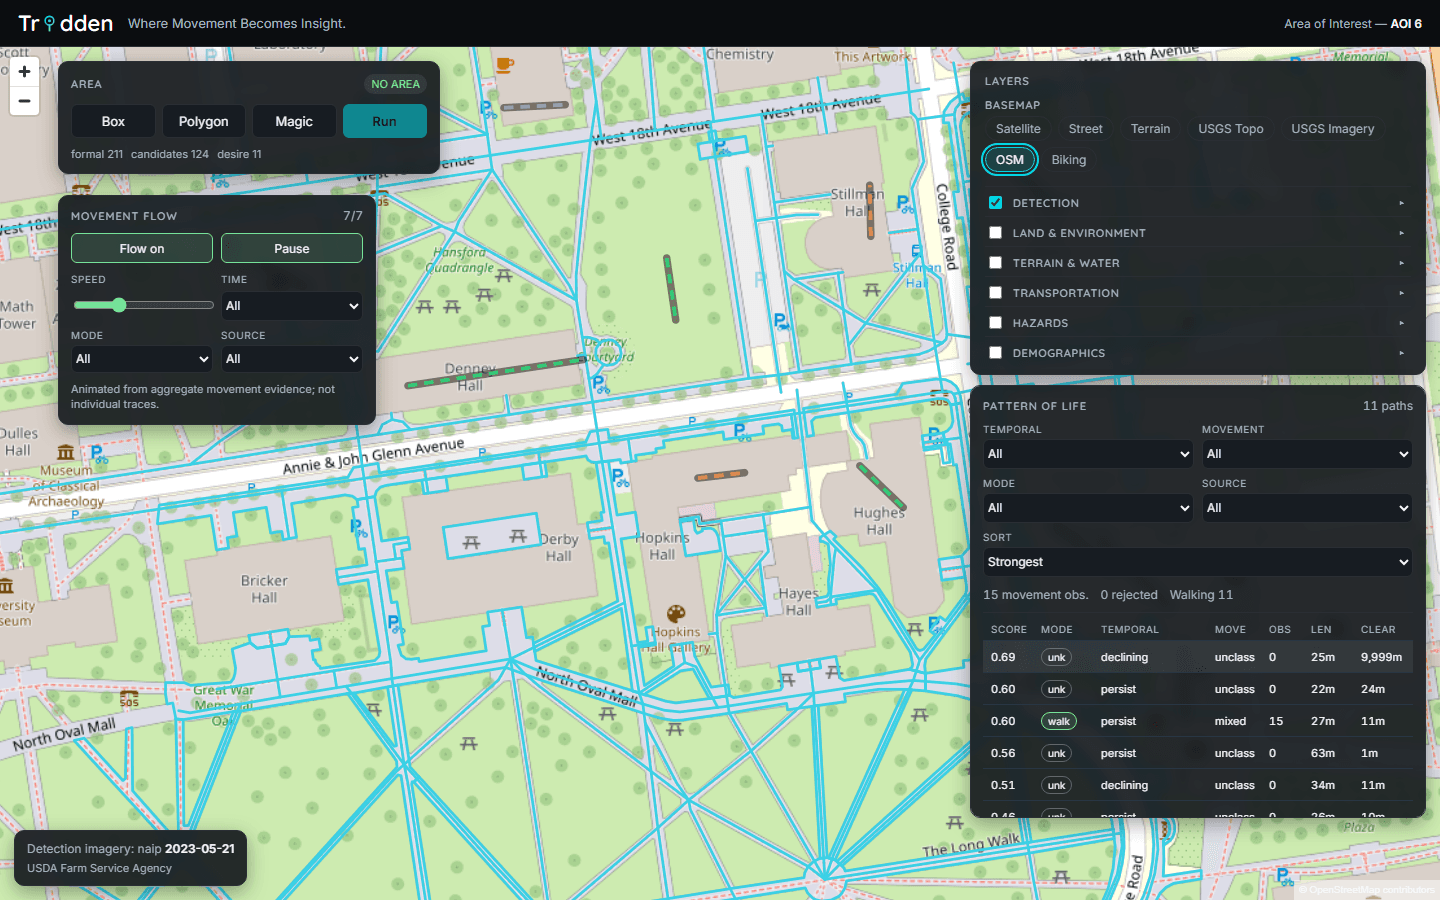
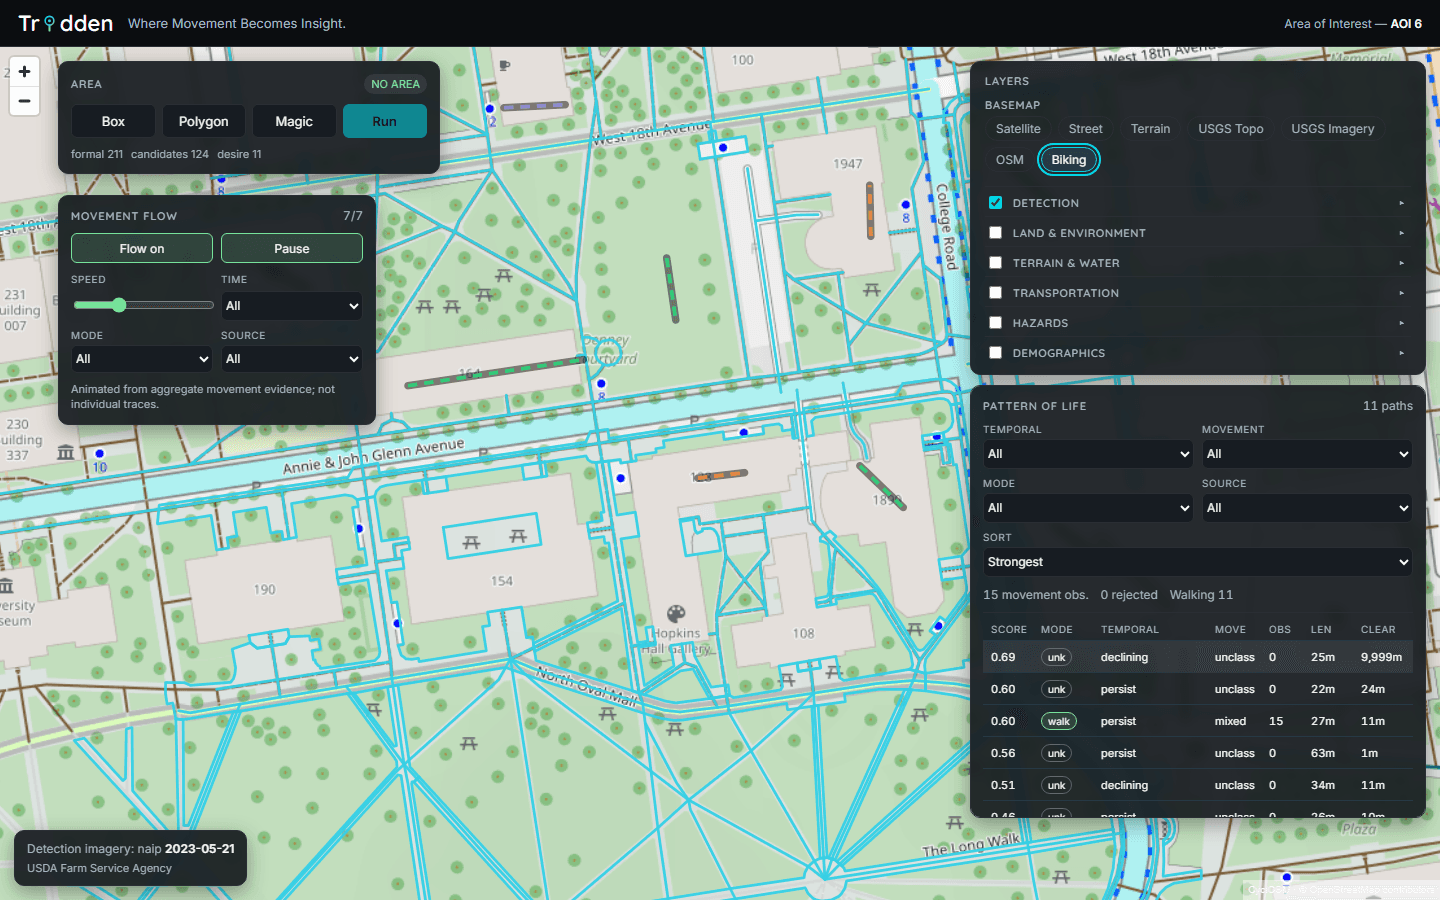
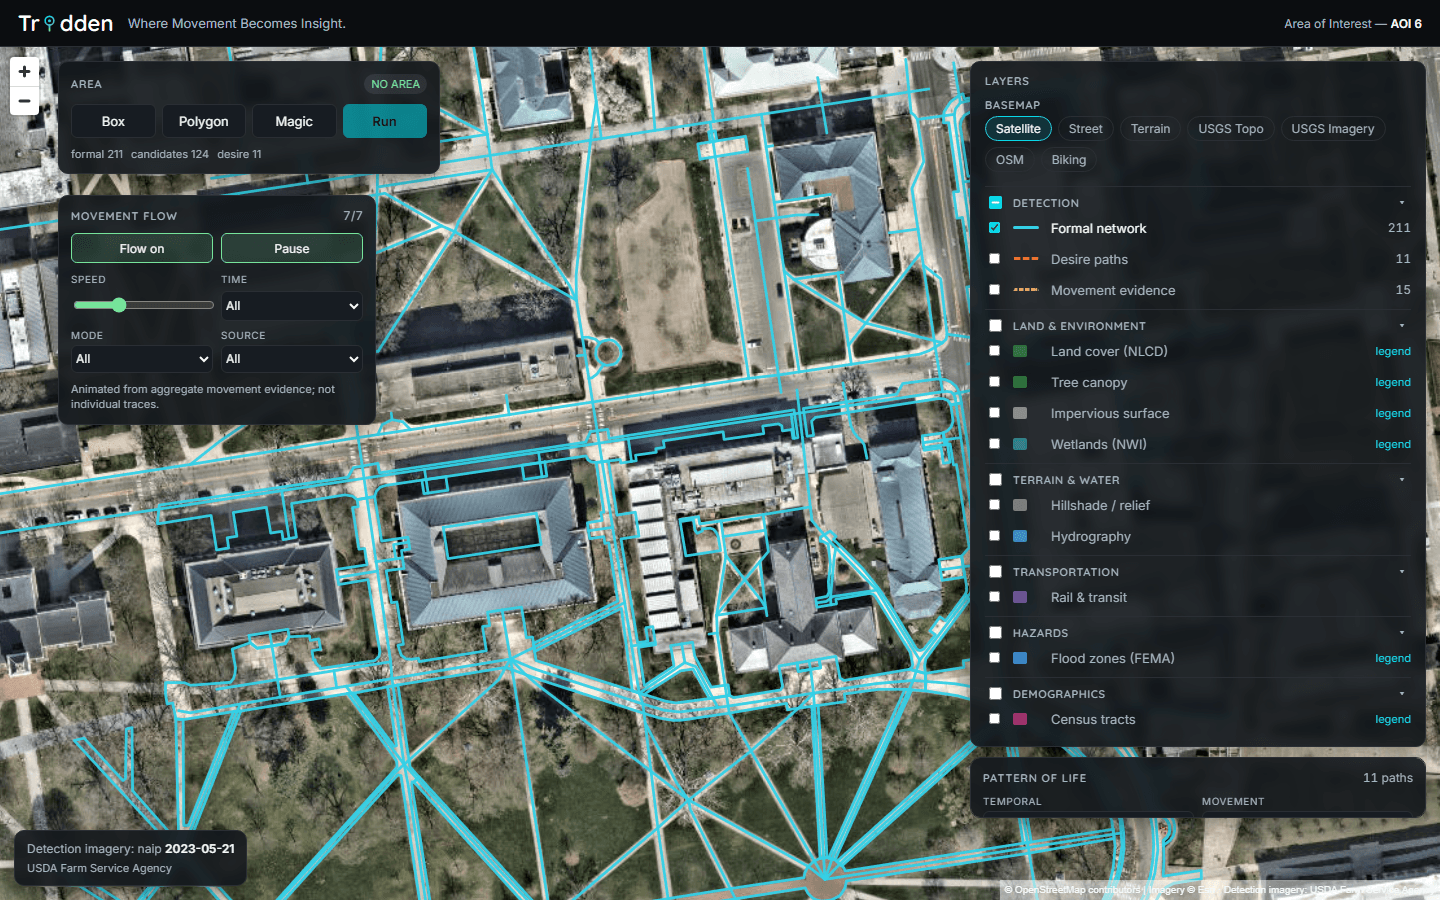
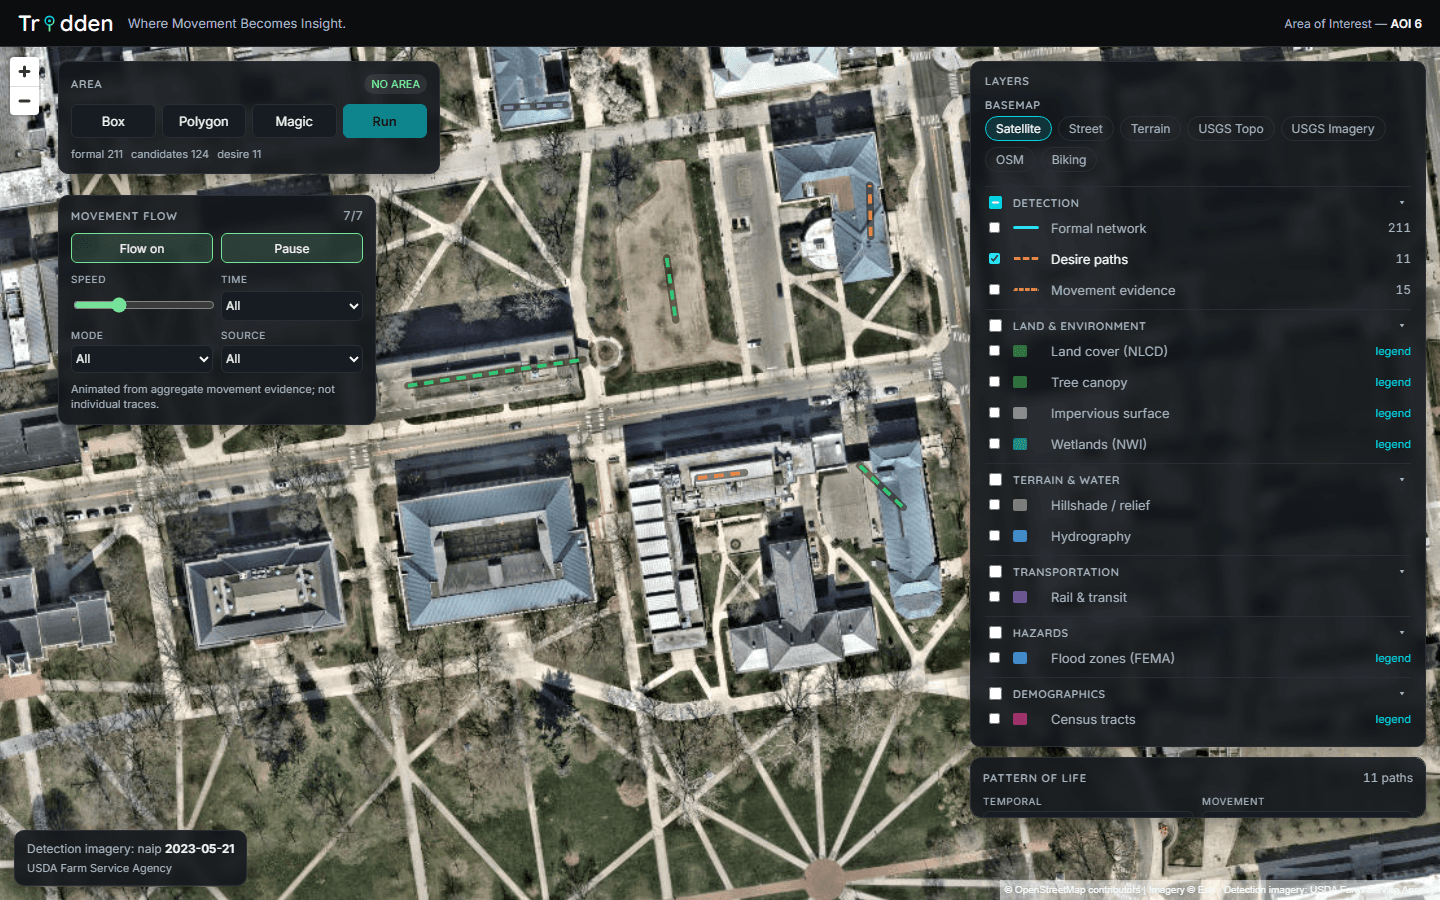
Twenty-four key-free layers, one registry.
The map framework is registry-driven: adding a basemap or overlay is a configuration entry, not an engine change. Everything ships key-free — no API billing surprises for a deploying agency.

Seven basemaps


Analytical overlays
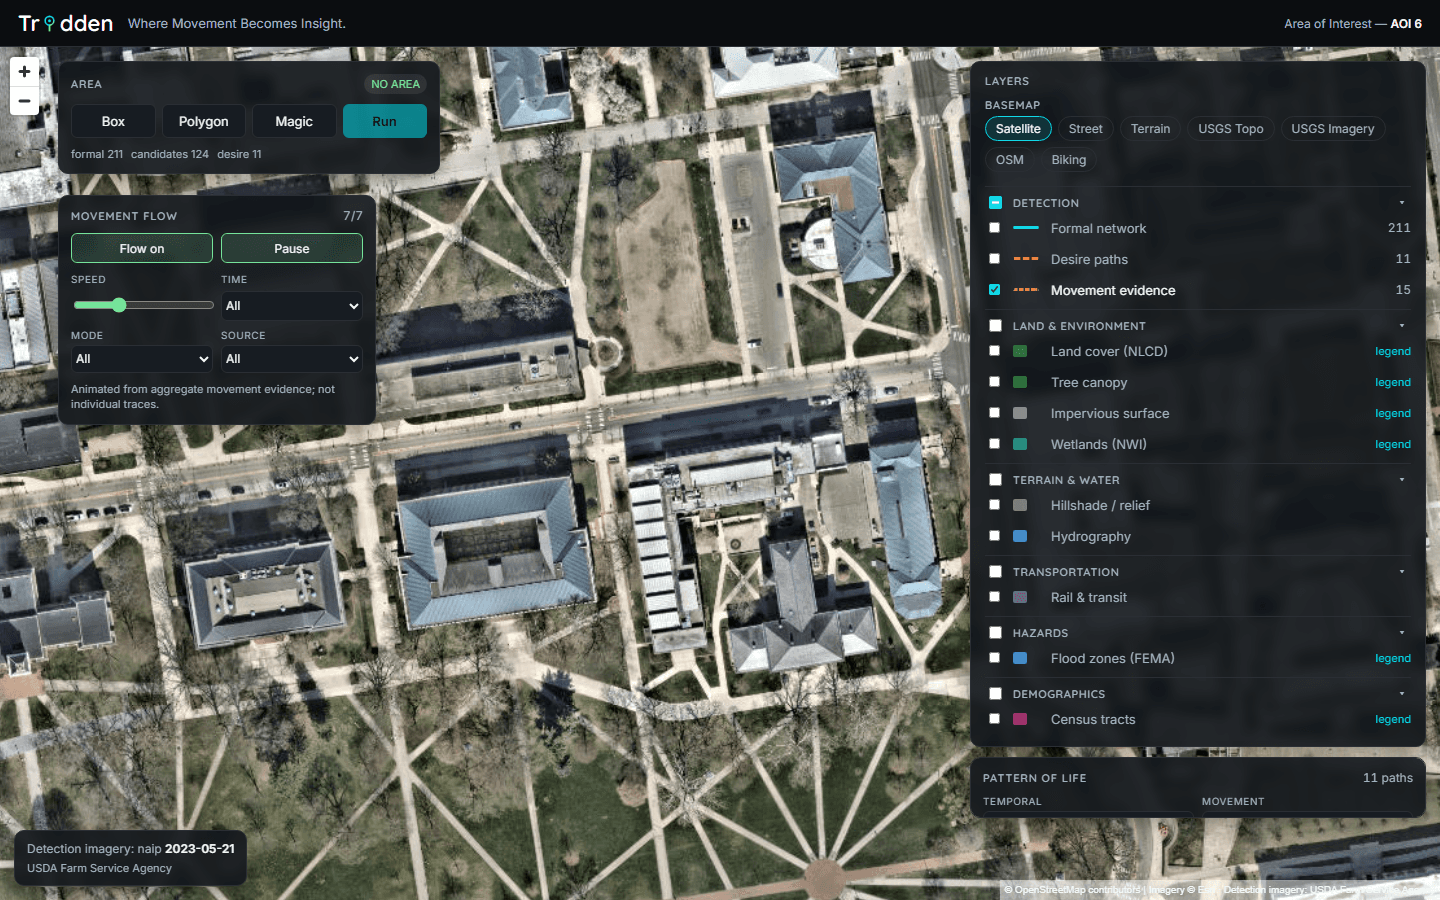
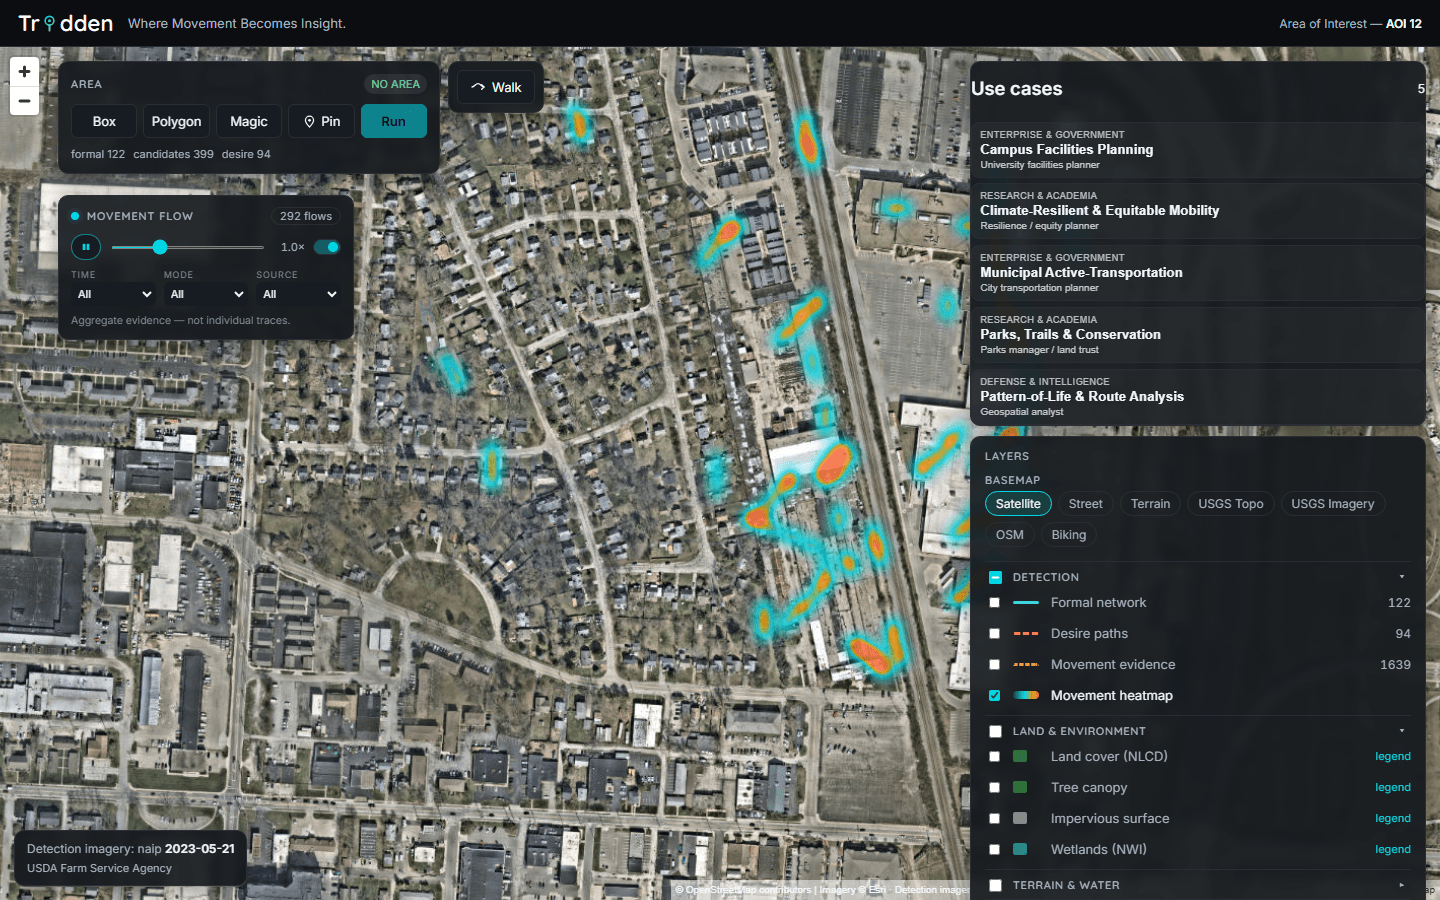
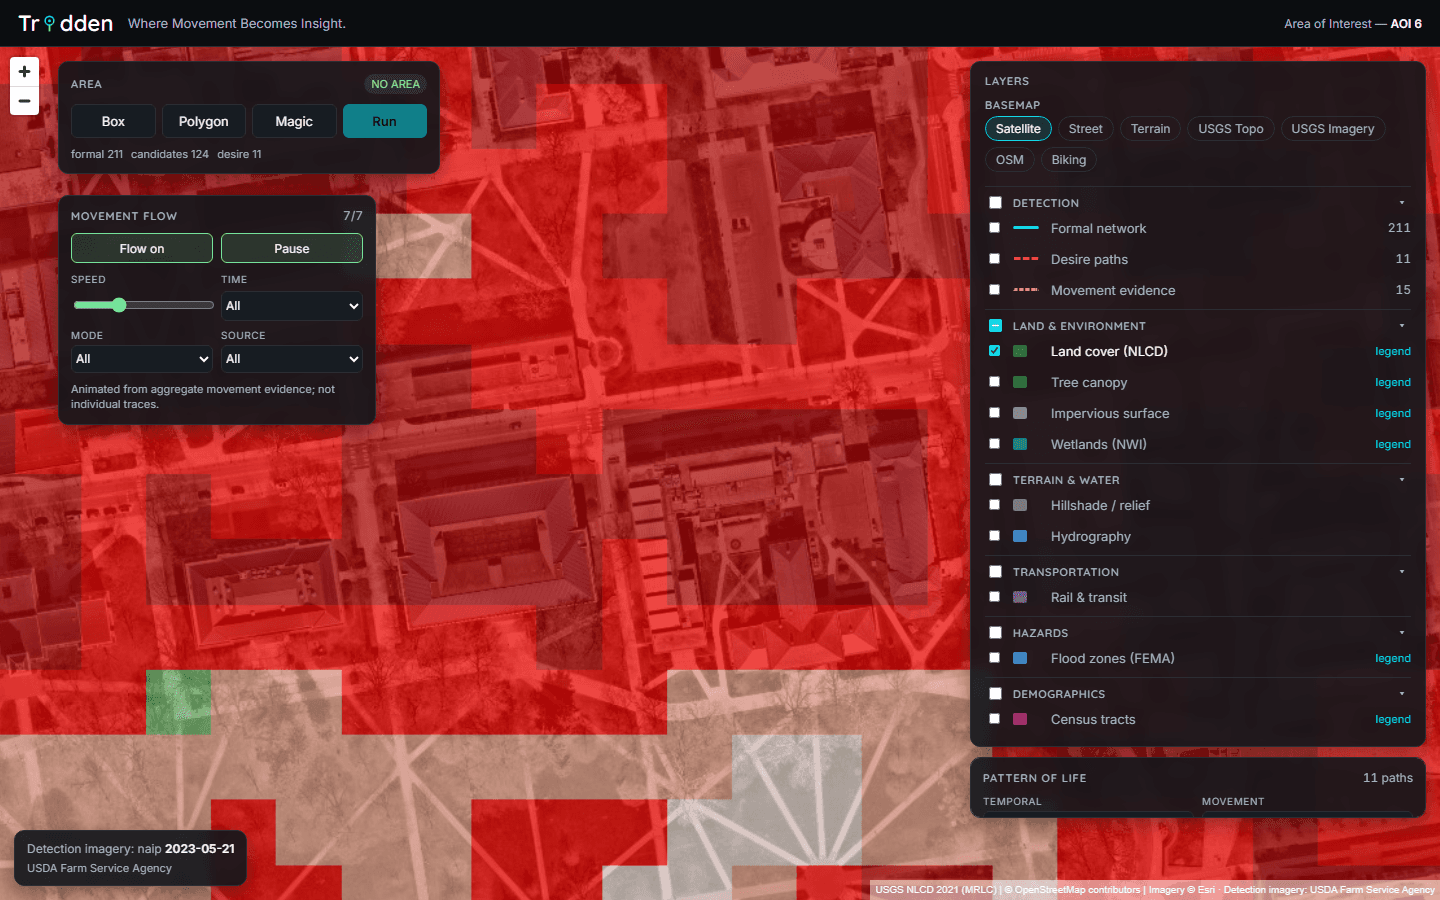
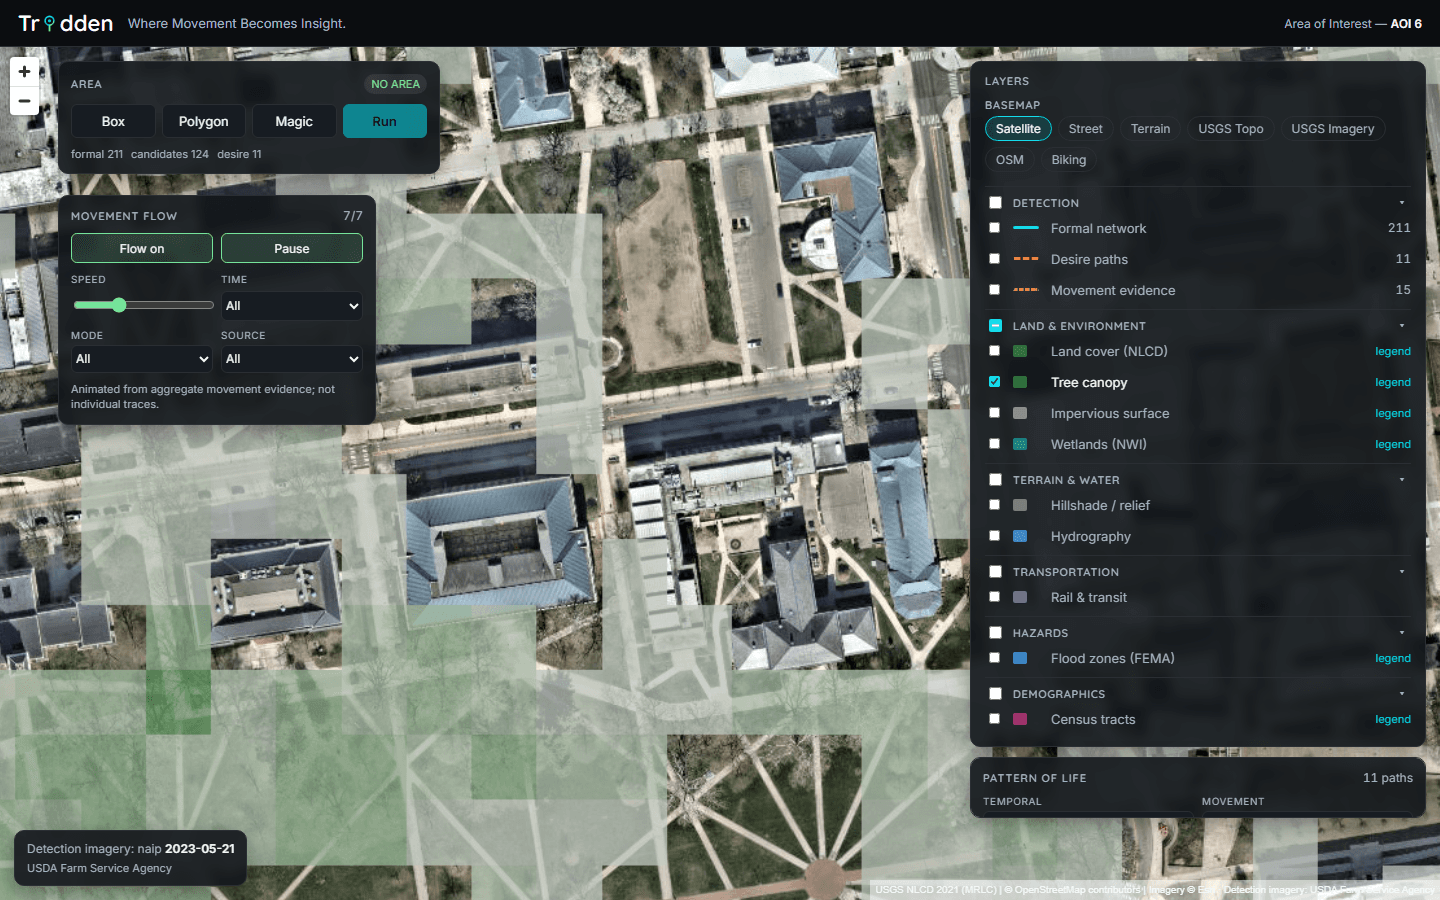
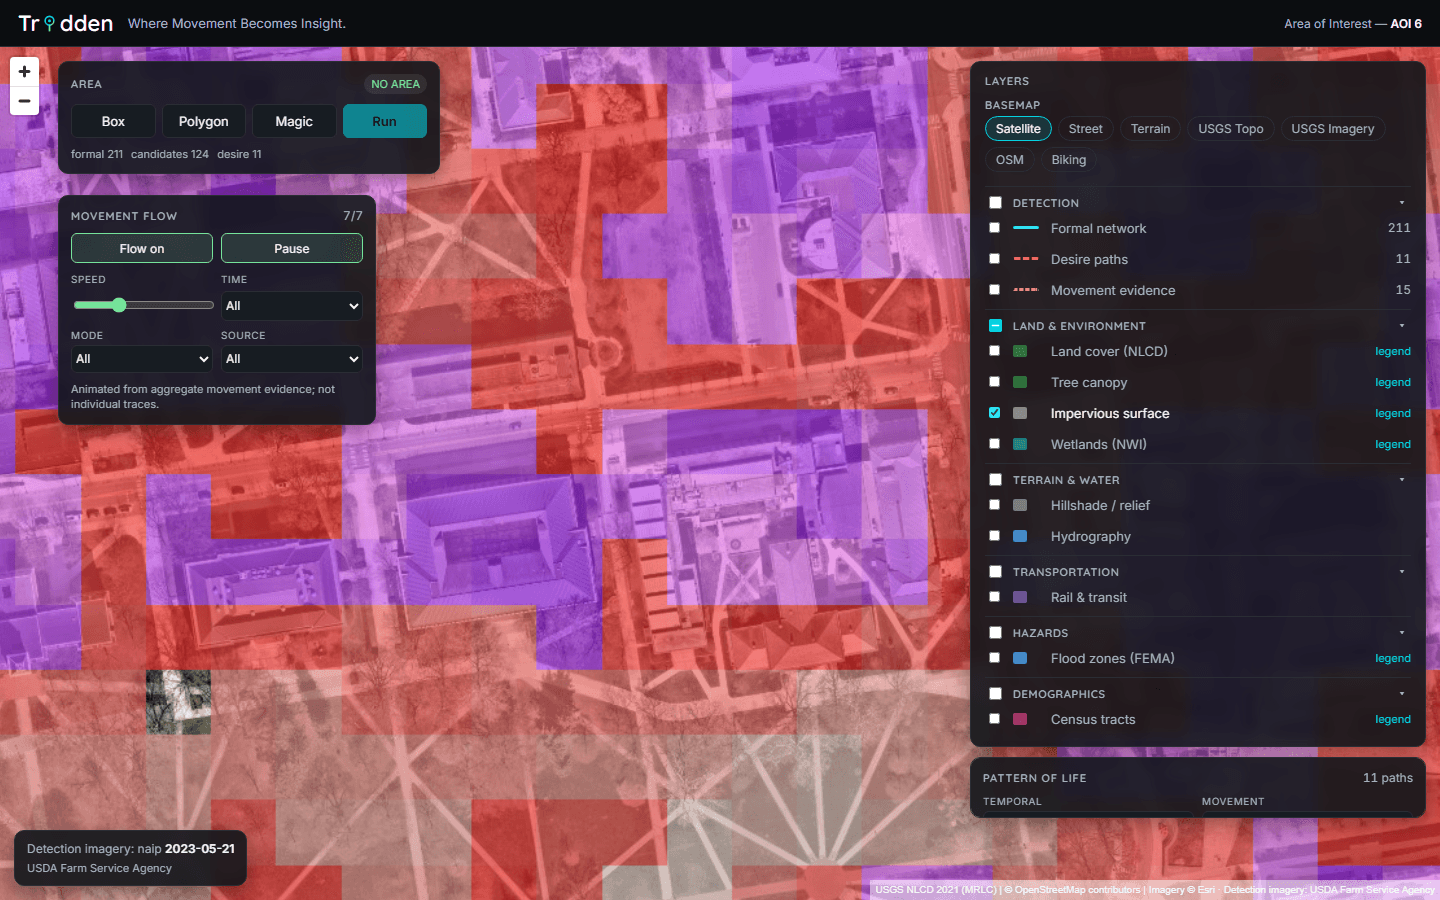
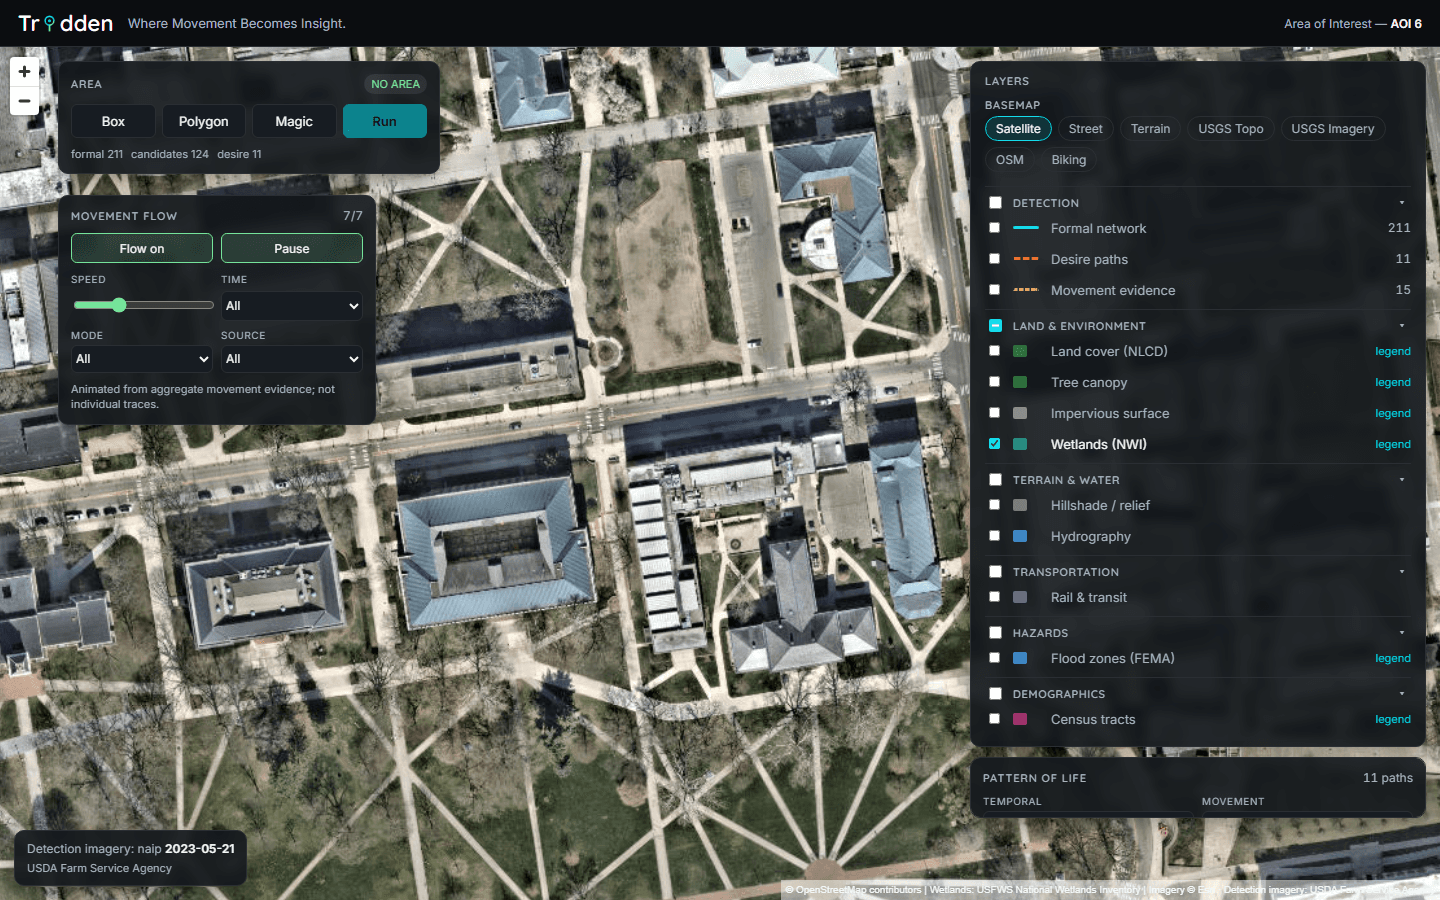
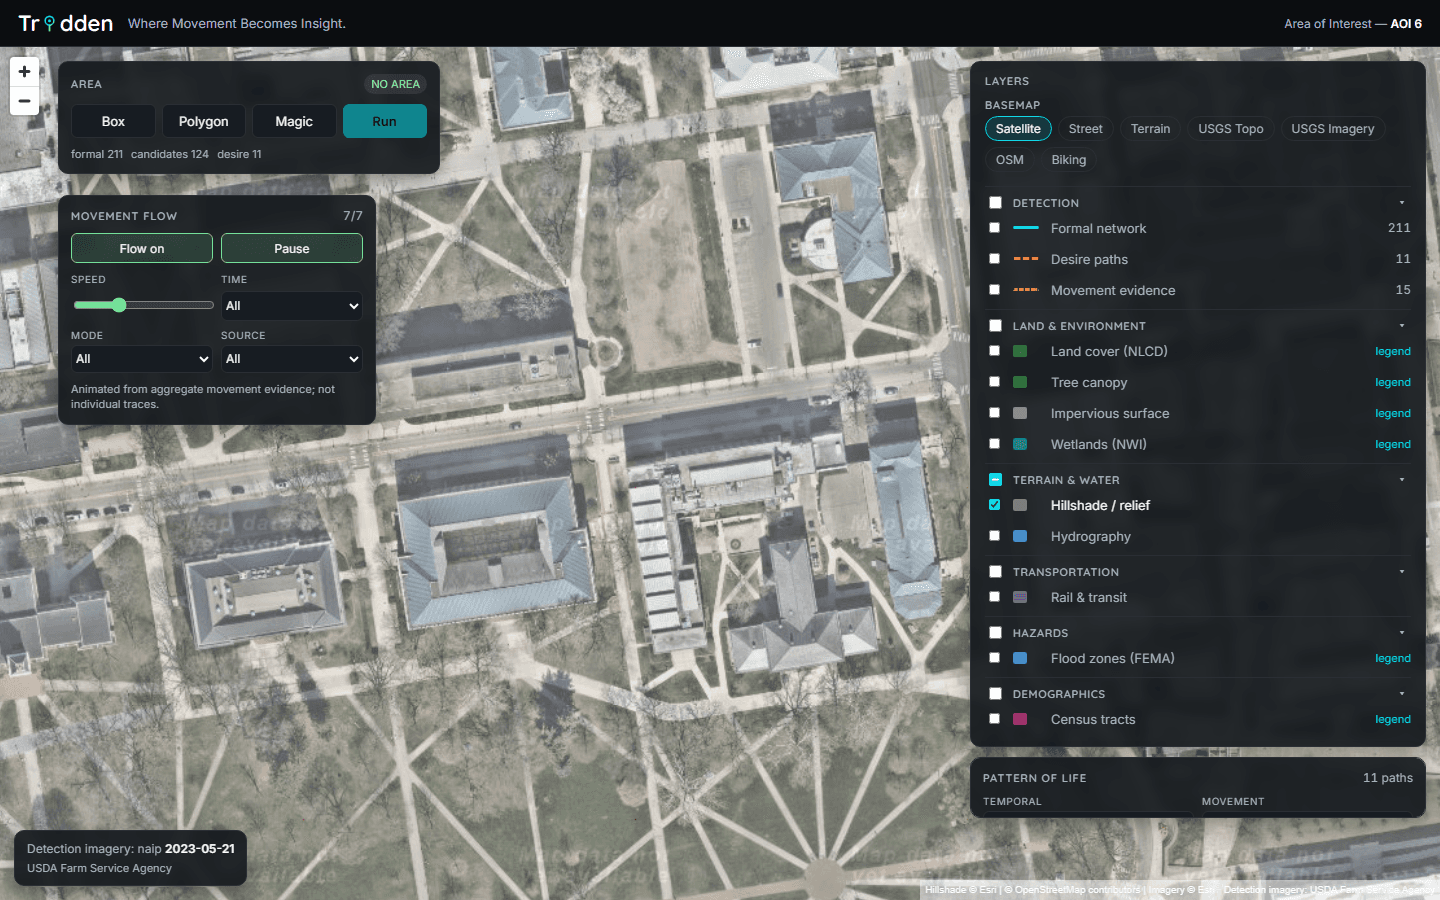
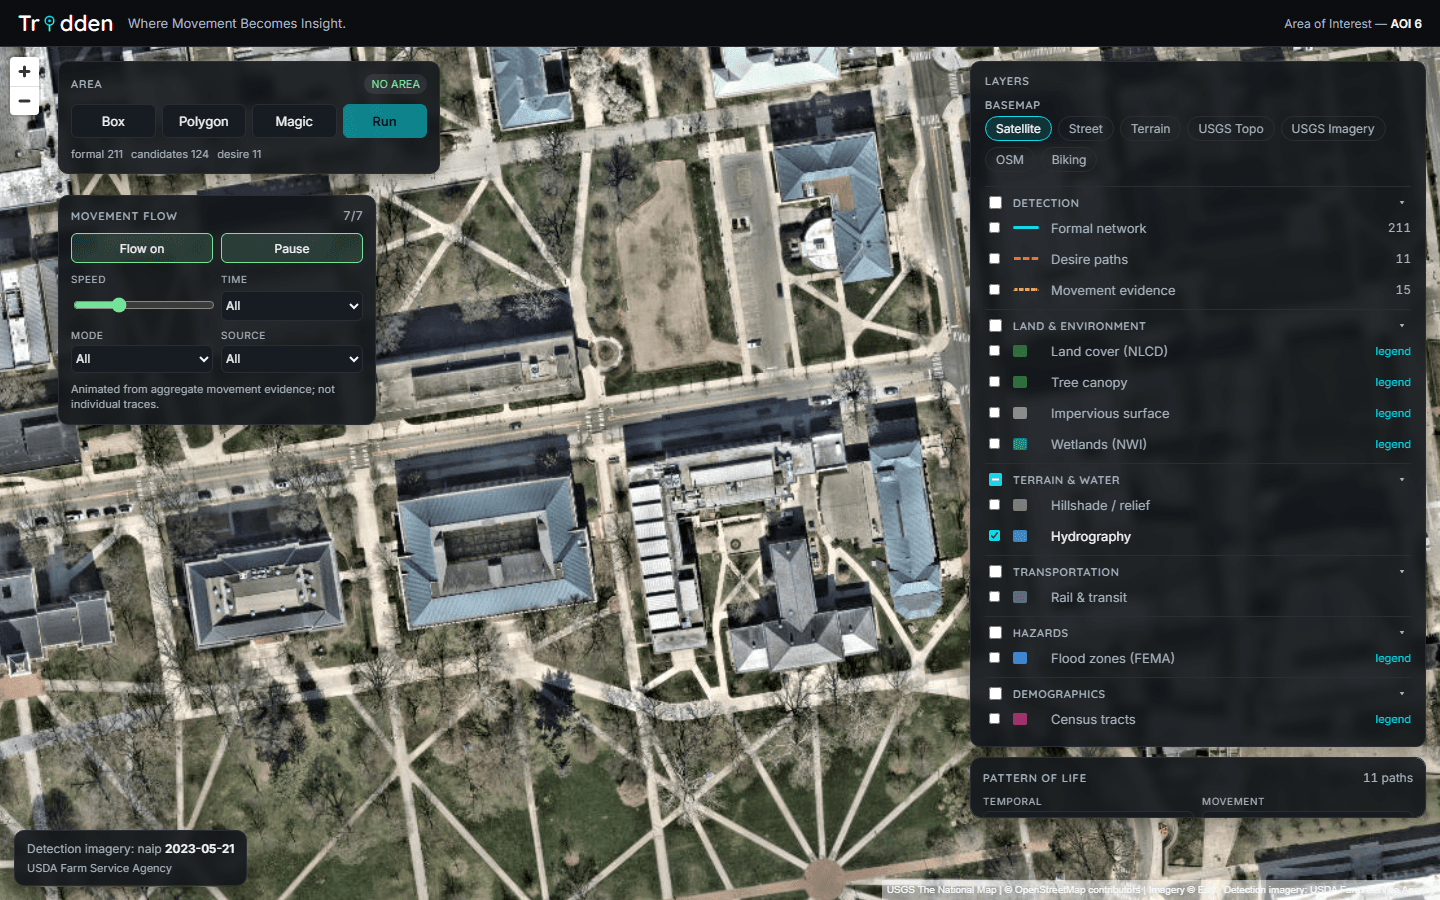
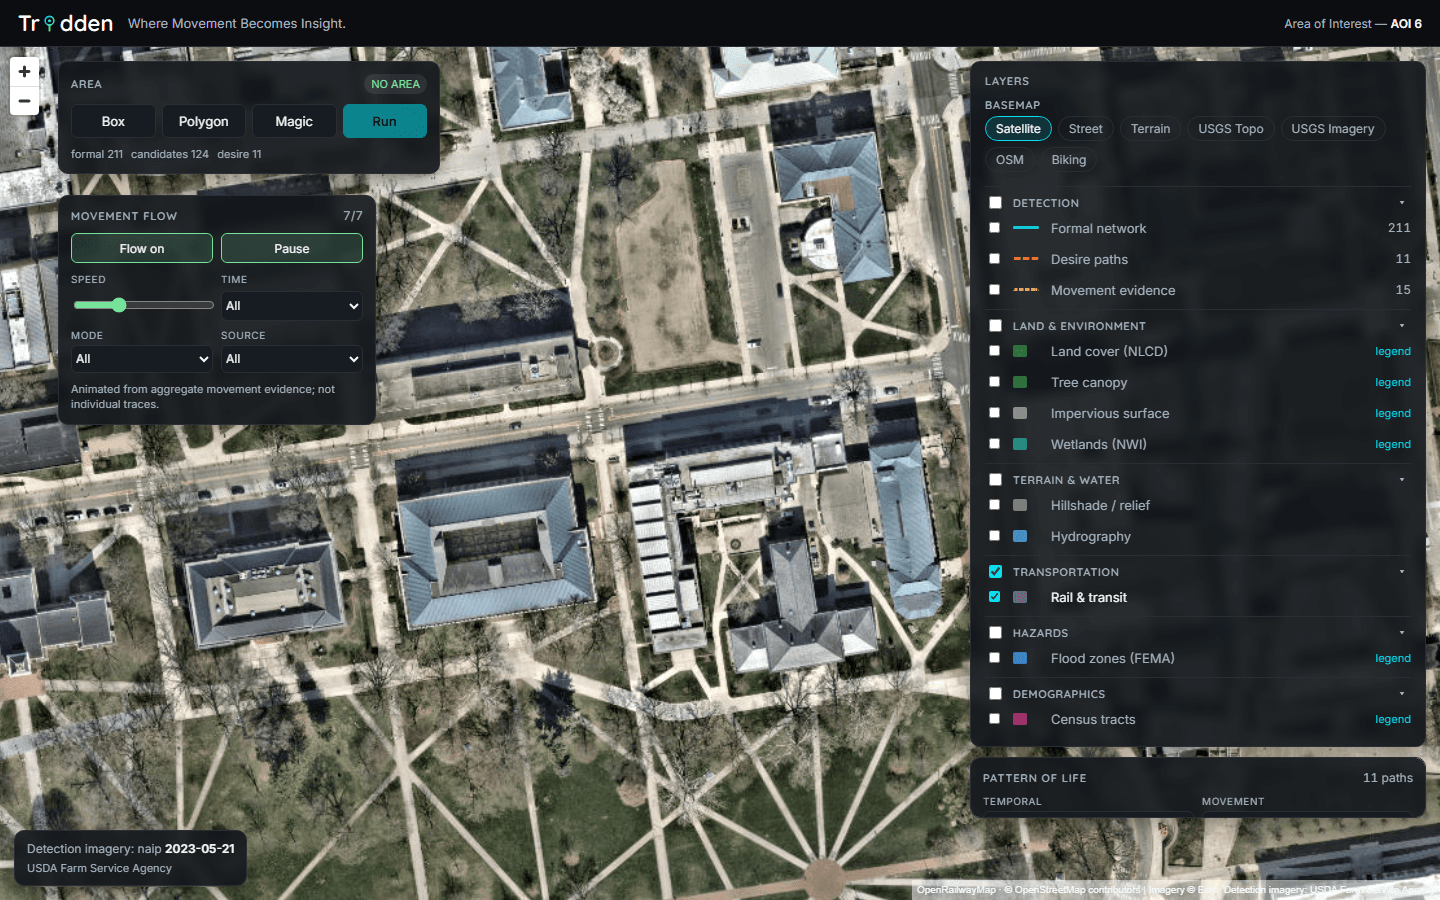
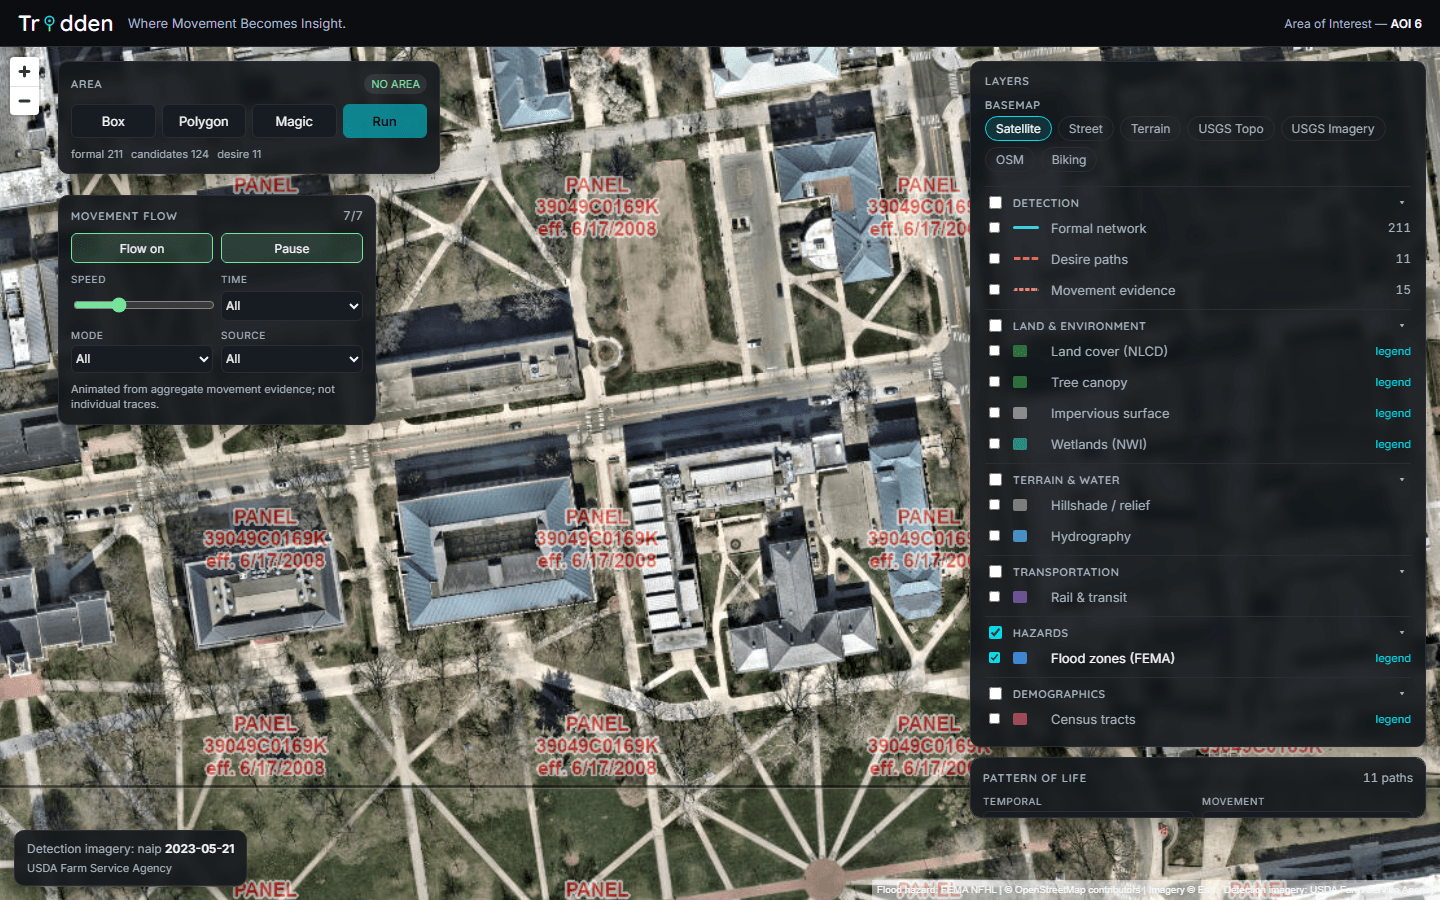
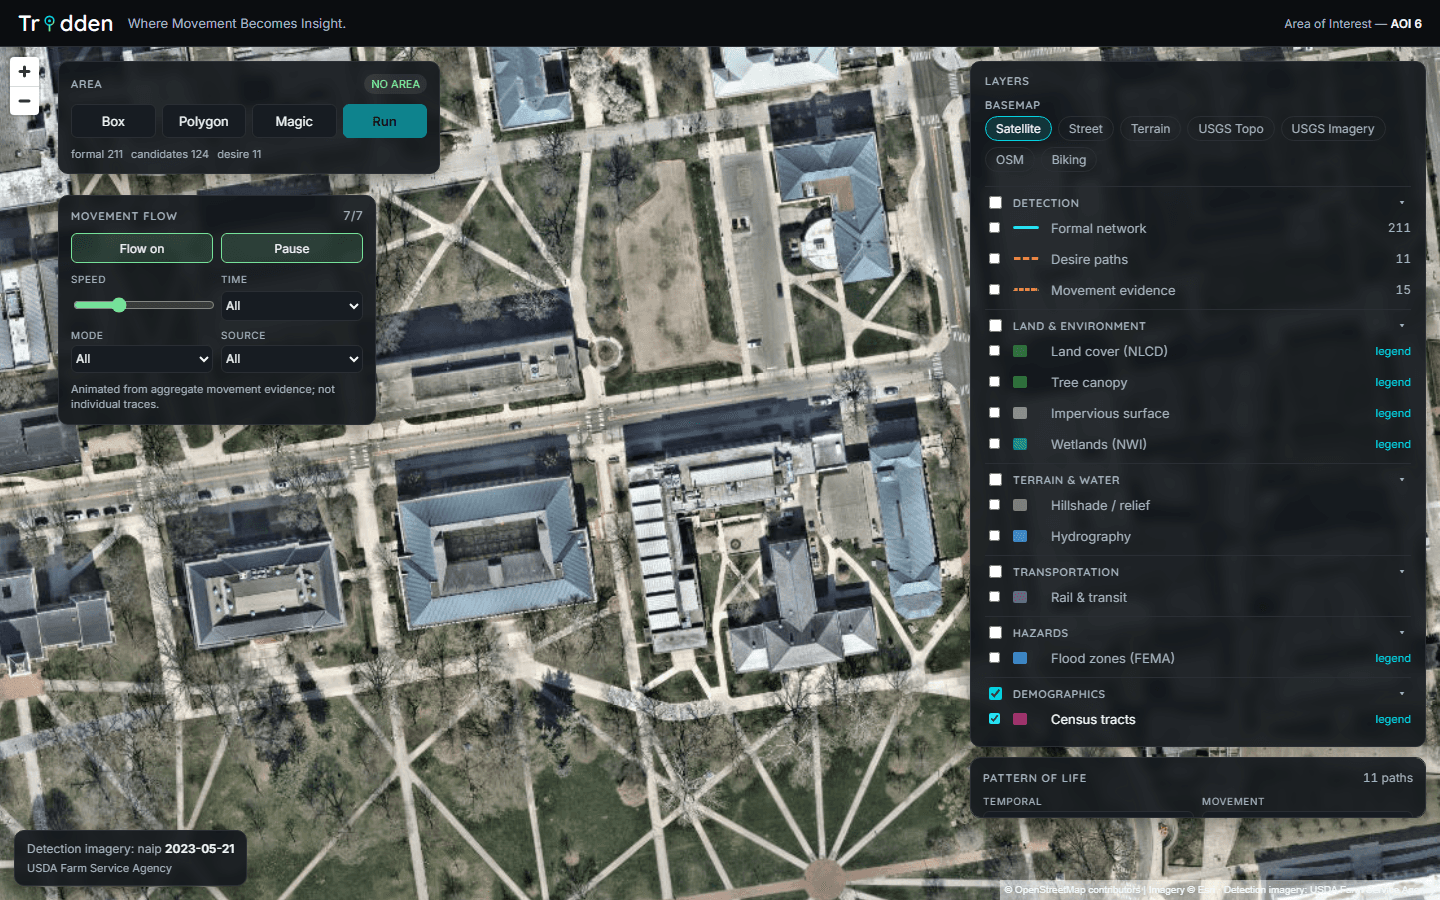
One platform, five mission presets.
A use-case launcher reconfigures the entire surface — basemap, overlays, filters, area of interest — for the mission at hand. Each vertical is a registry entry, so new missions are additive.


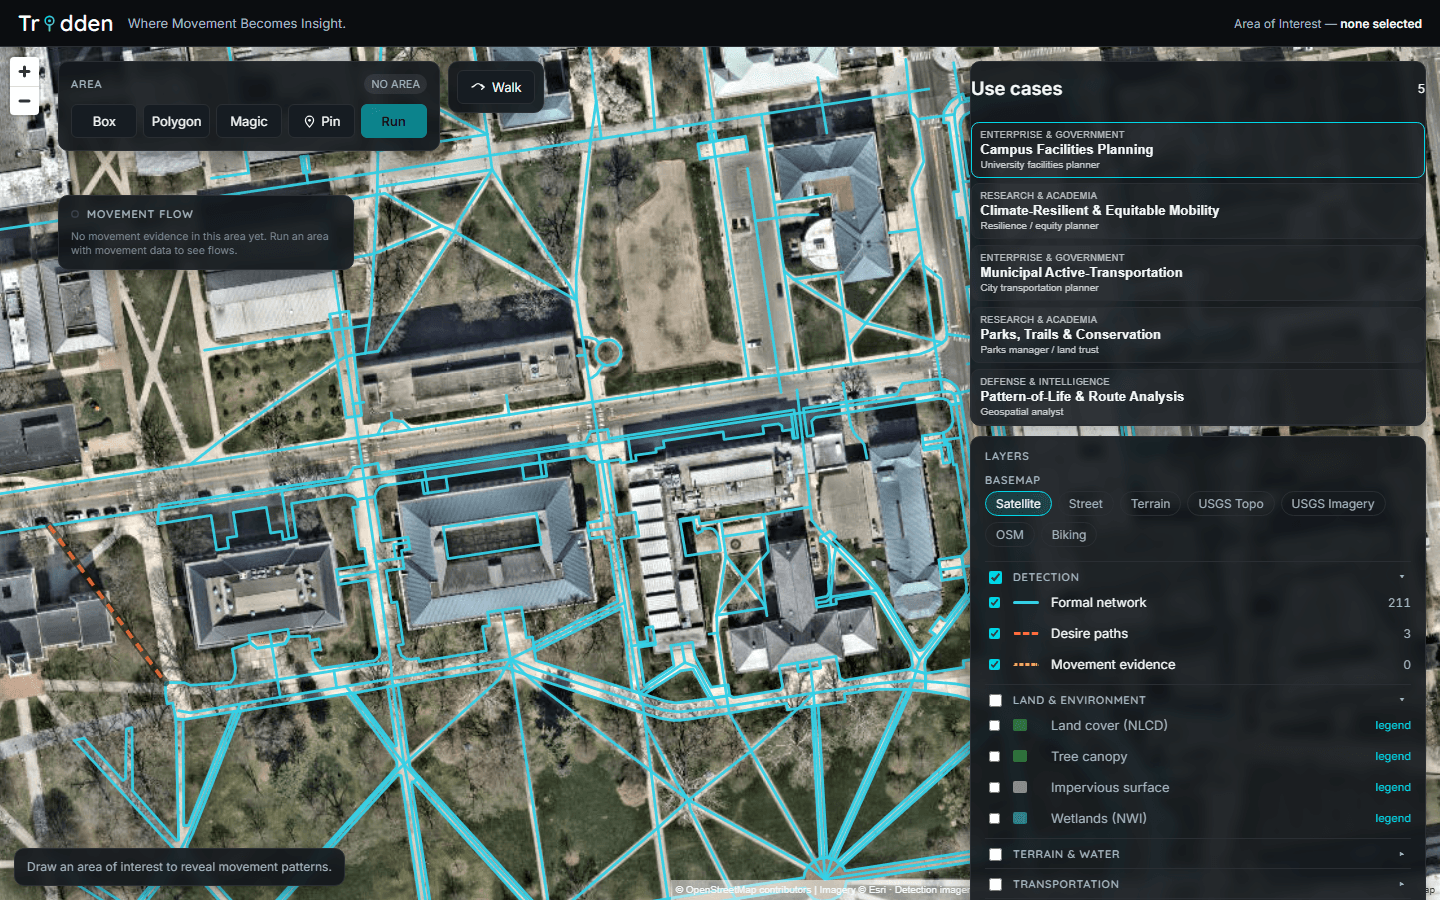
Campus Facilities
Where students actually cross the quad — validated on real OSU Oval detections.
Municipal Active Transportation
Vision-Zero-grade evidence for sidewalk and crossing investment.
Parks, Trails & Conservation
Informal trail pressure on protected land, tracked season over season.
Defense Pattern of Life
Movement rhythm analysis on open data — the same discipline, different terrain.
Climate-Resilient Mobility
Where walking demand meets flood zones, canopy gaps, and heat exposure.
Defensible by construction.

Every distance decision — diff gates, movement matching, pin autolinking — runs through PostGIS geography casts. Spatial claims survive scrutiny.
Import batches, source URIs, match methods, match distances, and rejected rows are all preserved. The audit trail is the schema.
Movement rendering and scoring operate on weighted aggregate evidence. The interface says so, the API contract says so, and the data model enforces it.
OSM, NAIP, Sentinel-2, USGS, FEMA, Census, Caltrans, GBFS, OpenFreeMap, AWS Terrain — a deploying agency needs zero commercial map keys.
262 automated tests across the pipeline, geometry math, and UI logic — plus recorded live-browser verification of every workflow shown here.
FastAPI · PostgreSQL/PostGIS · Martin tiles · React + Vite · MapLibre GL JS · OpenCV · GeoPandas / Shapely / Rasterio.
All captures recorded live from the platform against the dev stack on July 2, 2026. Aggregate movement evidence only — never individual traces.
Point Trodden at a place you already argue about.
A campus quad, a corridor with informal crossings, a park absorbing trail pressure. We run the detection pipeline on your area of interest, ingest the movement data you already have, and hand you a walkable, defensible evidence pack.
Start a pilot conversation