Supporting 6,181 Visitors with an AI Event Concierge
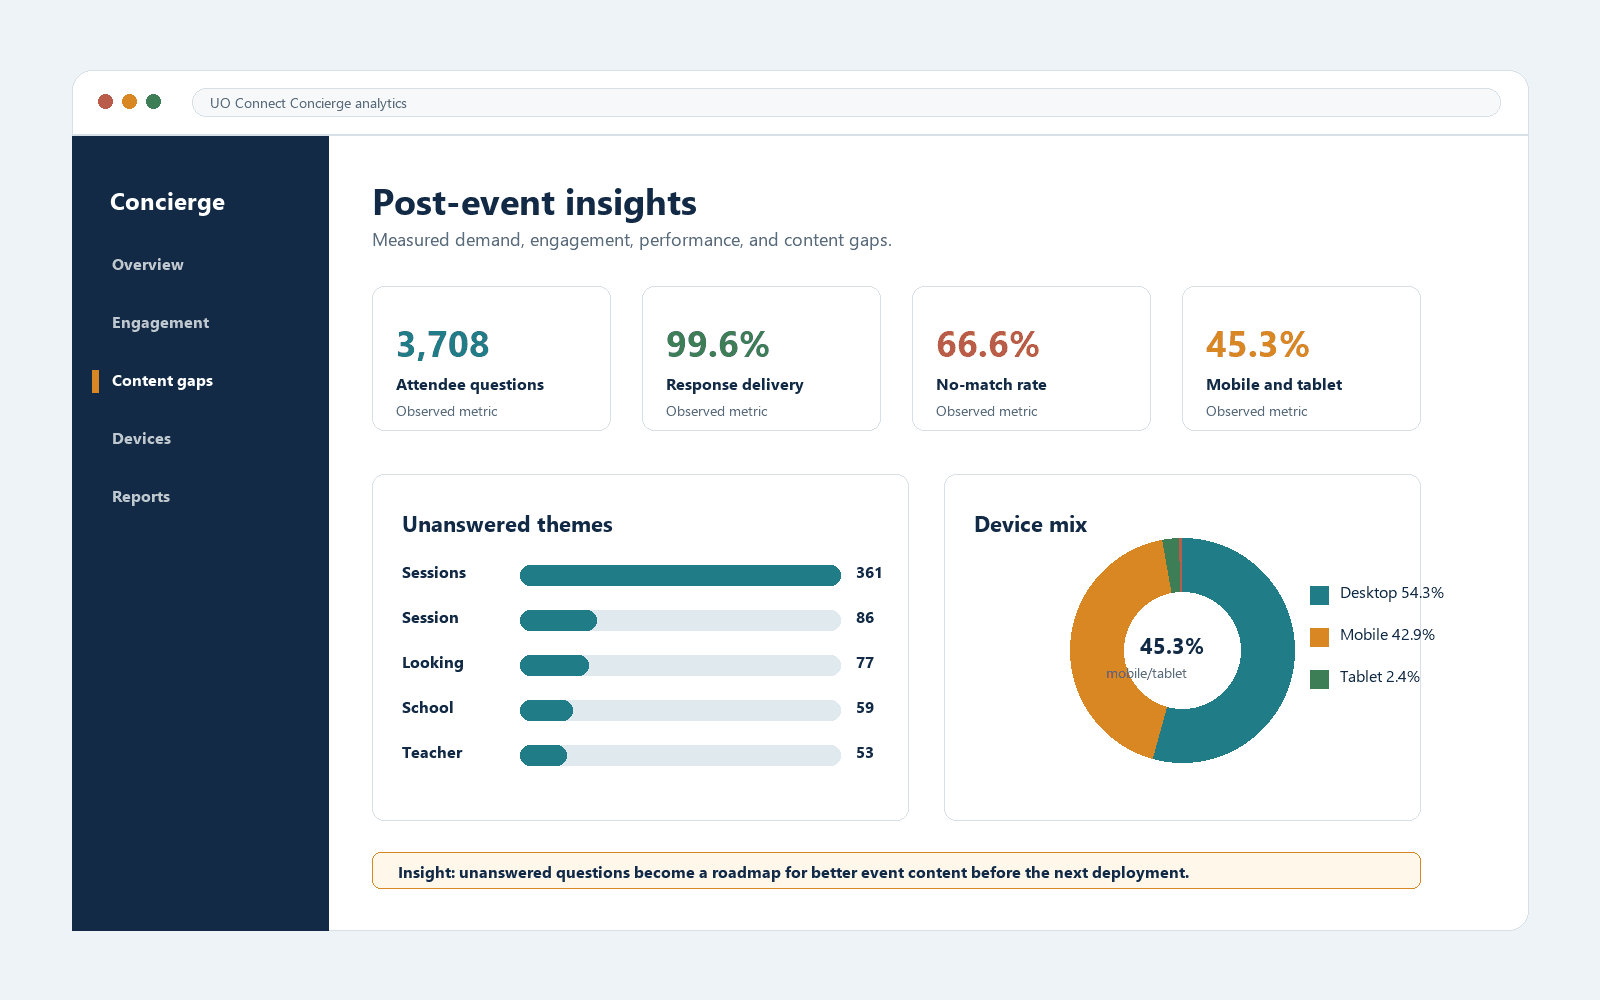
The deployment supported 6,181 unique visitors, 15,582 widget sessions, and 3,708 attendee questions, with 3,693 responses delivered across the reporting window. The data also revealed a 66.6% no-match rate, creating a clear knowledge-coverage roadmap for future events.
- Client / event
- ISTELive 26 and ASCD Annual 26
- Product
- UO Connect Concierge
- Service line
- AI/ML Engineering + Intelligent Automation
- Source
- Post-event analytics report, July 1, 2026
Important distinction: response rate measures whether the system returned a response, not whether every response fully resolved the attendee's request.
Large programs create dynamic attendee navigation needs.
Large conference programs create dynamic attendee navigation needs. Attendees need session recommendations, schedule context, room and topic guidance, and follow-up support across desktop and mobile during compressed event windows.
Deployed an embedded event concierge grounded in structured program content, scoped to event-support questions, and instrumented with usage, response-delivery, no-match, device, and content-gap reporting for organizers.
The deployment supported 6,181 unique visitors, 15,582 widget sessions, and 3,708 attendee questions, with 3,693 responses delivered across the reporting window. The data also revealed a 66.6% no-match rate, creating a clear knowledge-coverage roadmap for future events.
What the deployment measured.
Response delivery, relevant-match coverage, and attendee resolution are separate measurements. The source report measured delivery and no-match behavior, not satisfaction or task completion.
Audience scale during the reporting window.
Repeated use and return visits across the event window.
Submitted attendee demand, not answer quality.
Reporting-window response count.
System returned a response; not a satisfaction or resolution metric.
Knowledge coverage gap and future content roadmap.
Share of engaged sessions with two or more questions.
Portable-device usage during the event.
How the concierge was positioned for the event.
Embedded attendee access
The concierge was delivered as an embedded web experience inside the event environment, giving attendees a familiar place to ask natural-language session questions.
Structured program grounding
Responses were grounded in event program content such as sessions, days, times, rooms, tracks, topics, and program links when those fields were available.
Event-scope constraints
The experience was framed around session and event-information support rather than a general-purpose chatbot.
Telemetry and reporting
Usage, response delivery, no-match behavior, device mix, and content-gap themes were measured for operational monitoring and post-event analysis.
What attendees and organizers see.
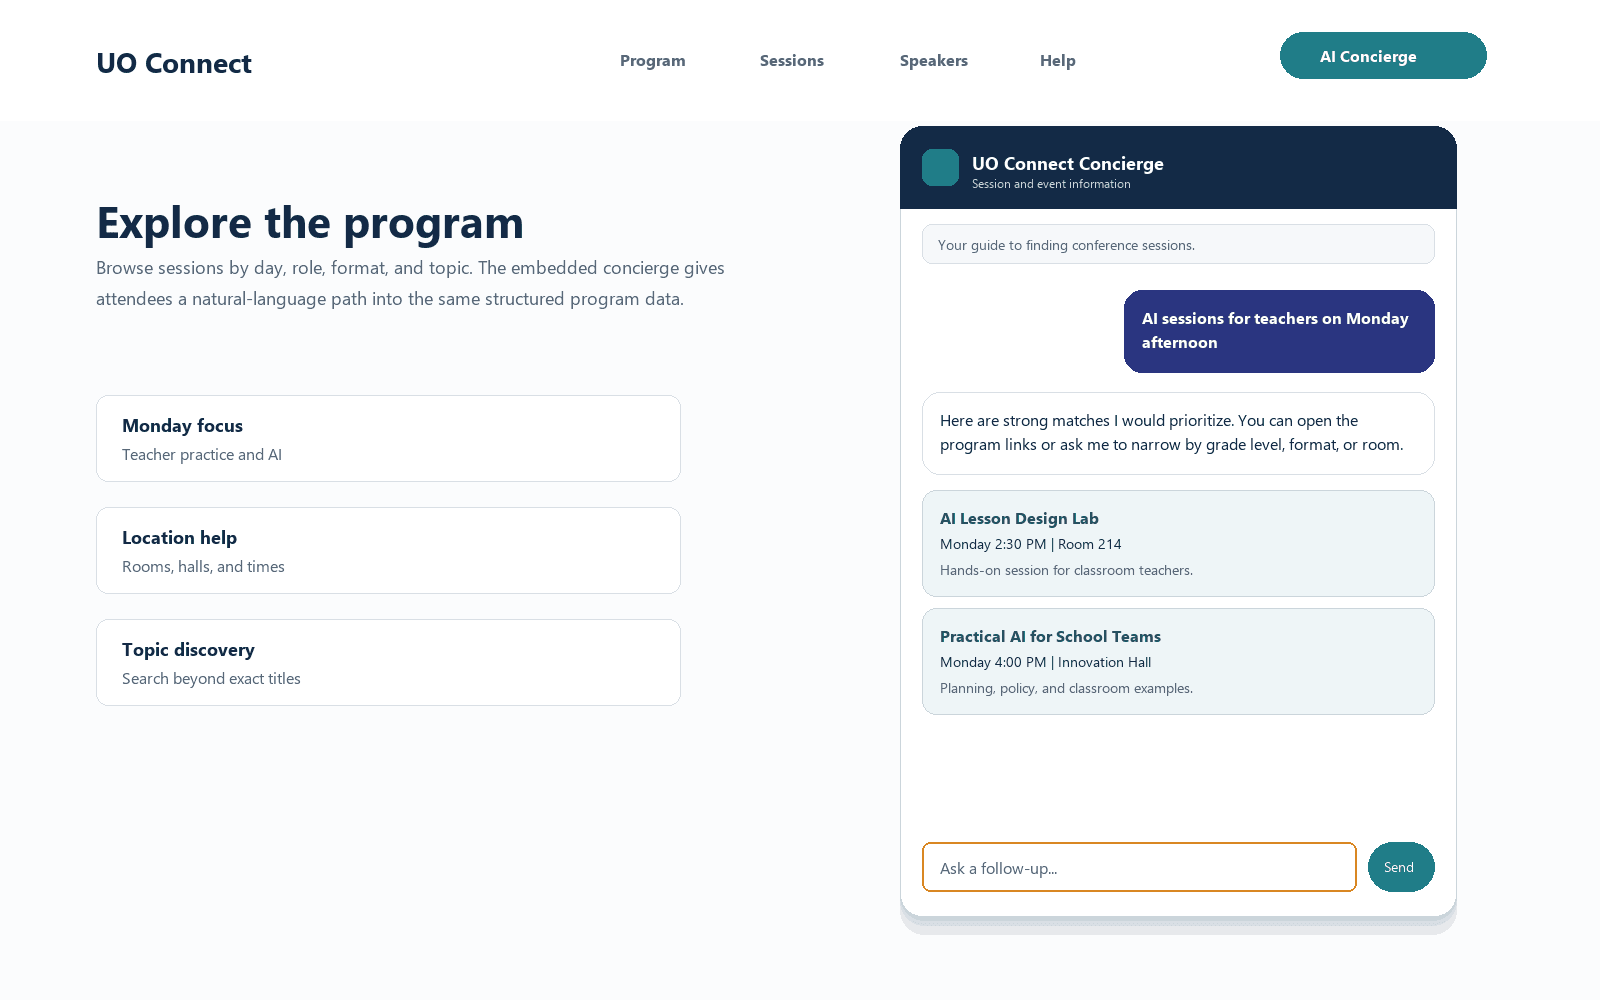
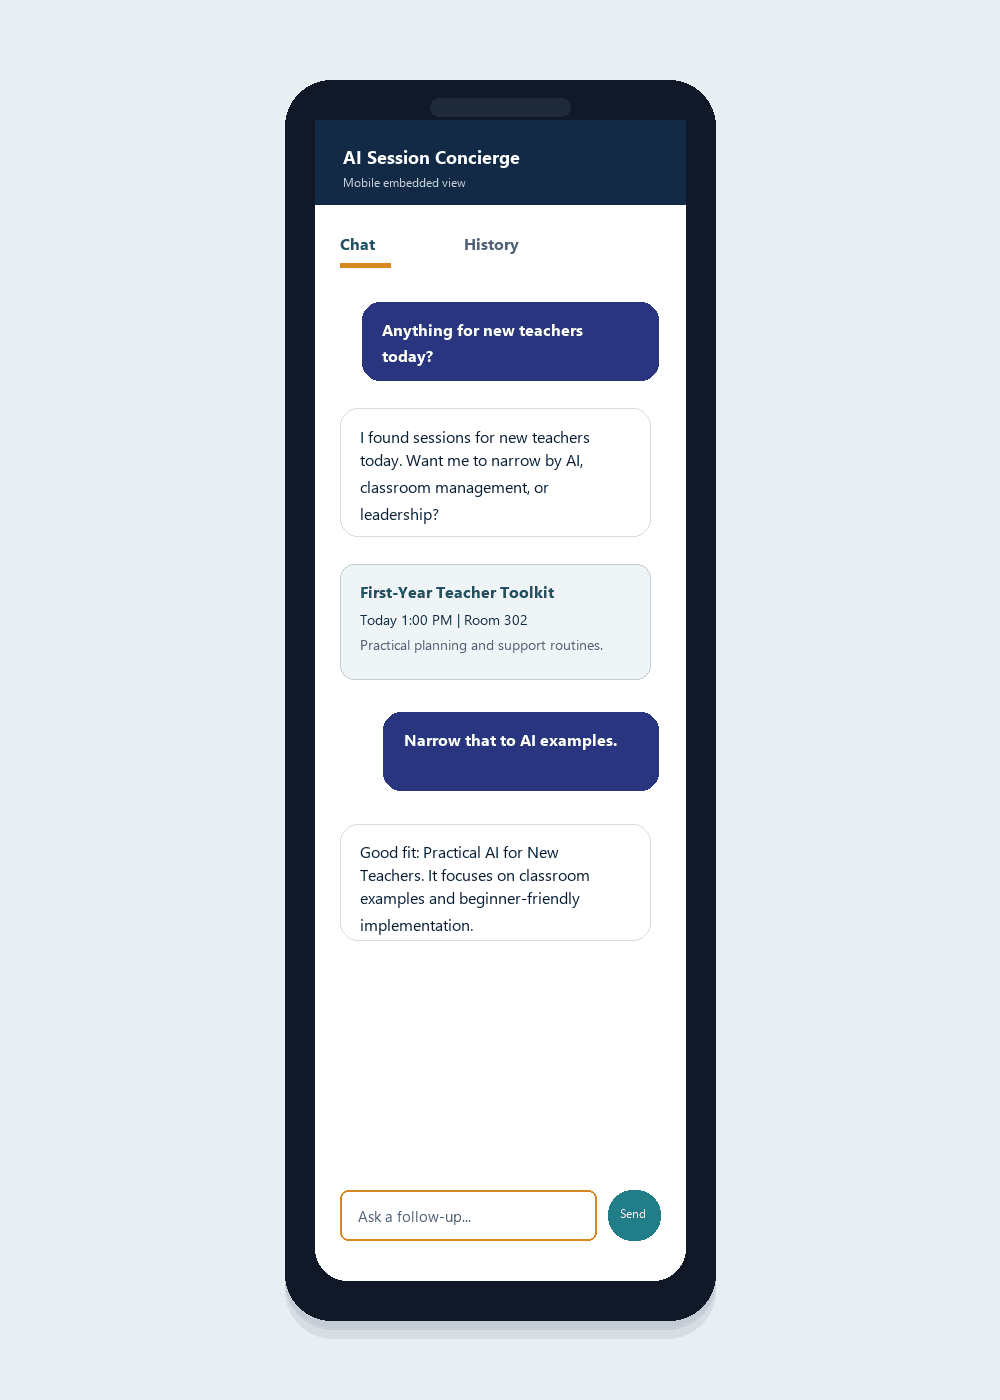
These visuals are representative product screens and do not include private attendee conversations.
From visibility to submitted questions.
The corrected funnel separates widget exposure, opened sessions, engaged sessions, submitted questions, and delivered responses.
The concierge was visible across the event experience.
27.9% impression-to-open.
Sessions that asked at least one question.
Engaged attendees often asked more than one question.
Response delivery, not answer resolution.
System availability alone is not enough.
The technical service returned responses to nearly all questions. The 66.6% no-match rate showed that the quality and structure of the underlying event data determine whether an attendee receives a useful result.
Practical improvements for future events.
- Normalize session titles, dates, times, rooms, tracks, formats, speakers, audiences, and topic tags.
- Support multi-constraint requests such as AI sessions for teachers on Monday afternoon.
- Track relevant-match rate separately from response-delivery rate.
- Add helpful/not-helpful feedback, recommended-link clicks, session saves, and task-completion measurement.
- Reduce average response time below 8 seconds and 95th-percentile response time below 10 seconds.
How to read these metrics.
- Response-delivery rate measures whether the system returned a response. It does not measure answer accuracy, satisfaction, helpfulness, task completion, or resolution.
- The 66.6% no-match rate is intentionally reported because knowledge coverage was the main limitation and a content-improvement signal.
- Cost, cache, and geography telemetry were unavailable or uninstrumented and are not used for public claims.
- Screenshots are representative product visuals and do not expose private attendee text.
Results are based on the UO Connect Concierge post-event analytics report generated July 1, 2026 from the client live instance.
Planning a complex conference or association event?
If your event program is too large for static search alone, start with a free consultation. We can scope the data, embedded experience, and reporting model around your environment.
Book a Free Consultation